Showing posts with label vines. Show all posts

Sunday 10 December 2023

Drought in rainy places


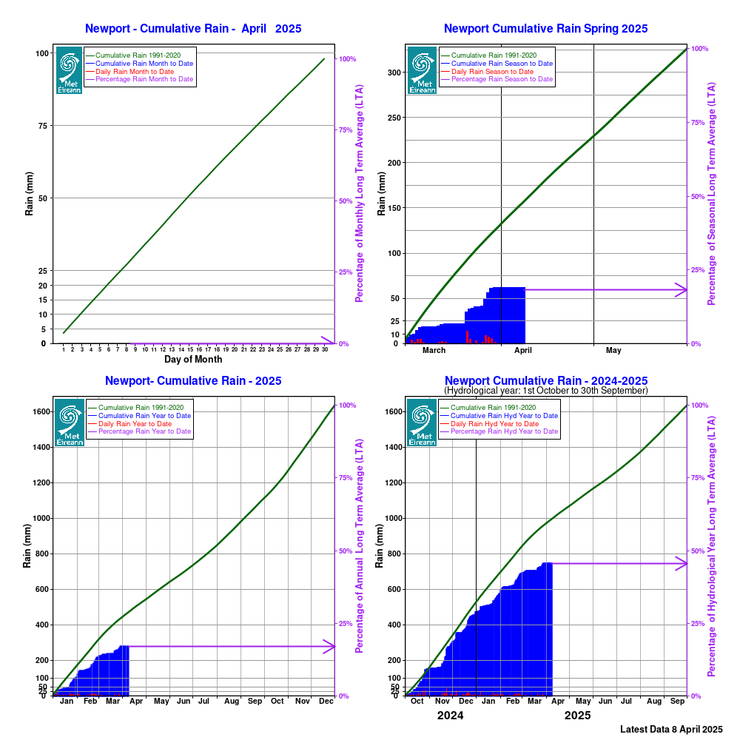
A new study of forests suffering from climate change has suggested that forests in typically wet climates may be more vulnerable than those already adapted to drier environments. That's my premise with vines: the roots remain shallower in wetter regions, whereas in drier regions they have to grow deeper to find water.

I don't know if that's been proven, but it's why the first couple of years, we let the vines grow very long above ground, hoping that would encourage them to grow equally long roots below ground. We had 6 weeks with almost no rain early this year followed by 6 weeks of extraordinary rain and the vines thrived. So I am hopeful that my strategy for adaptation to a shifting climate worked. 


Drought sensitivity in mesic forests heightens their vulnerability to climate change

ROBERT HEILMAYR, JOAN DUDNEY, AND FRANCES C. MOORE 

SCIENCE

7 Dec 2023

Vol 382, Issue 6675

pp. 1171-1177

DOI: 10.1126/science.adi1071


Editor’s summary

The increase in drought conditions caused by climate change threatens tree growth and survival. Heilmayr et al. investigated whether trees are most stressed by drought in relatively wet or dry regions. In drier areas, trees increasingly experience more severe conditions but may also be better adapted to withstand drought. Using tree ring measurement records from more than 100 tree species, the authors found that trees growing in the wetter parts of their range are more drought-sensitive, and hot, wet regions are predicted to have the greatest declines in growth under future climate change. Therefore, land management and policy focused solely on drought effects in drier regions will underestimate climate change vulnerability in forests. —Bianca Lopez

Abstract

Climate change is shifting the structure and function of global forests, underscoring the critical need to predict which forests are most vulnerable to a hotter and drier future. We analyzed 6.6 million tree rings from 122 species to assess trees’ sensitivity to water and energy availability. We found that trees growing in wetter portions of their range exhibit the greatest drought sensitivity. To test how these patterns of drought sensitivity influence vulnerability to climate change, we predicted tree growth through 2100. Our results suggest that drought adaptations in arid regions will partially buffer trees against climate change. By contrast, trees growing in the wetter, hotter portions of their climatic range may experience unexpectedly large adverse impacts under climate change.

Tuesday 2 August 2022

July weather


So July ended with the same rainfall as last year but 1.6 degrees cooler. Note that August 1, in one day, we had almost as much rain as we had the entire month of July. That's caused the grapes to swell rather quickly and they are noticeably bigger today than on Saturday. 


Meanwhile, Cathal Keane has arrived to begin work on the construction of the trellis structure that will support the remaining vines as they mature. Today, he is digging the holes for the uprights -- telephone poles discarded as they are replaced in our area. Tomorrow, they begin cementing in the poles in the holes. It's a big job. 


Monthly values for NEWPORT up to 01-aug-2022

Total rainfall in millimetres for NEWPORT

YearJanFebMarAprMayJunJulAugSepOctNovDecAnnual
202298.8260.467.884.0107.0148.059.247.5872.7
2021225.6147.6141.145.6113.564.159.7155.6137.0265.7183.3186.61725.4
2020139.5342.8178.225.554.7164.5187.9137.9153.4228.0206.6232.72051.7
2019146.8115.0228.5100.7112.576.682.7228.9175.5160.7148.1220.61796.6
LTA166.7126.5141.296.894.789.7100.9132.5131.5176.0170.4180.21607.1

Mean temperature in degrees Celsius for NEWPORT

YearJanFebMarAprMayJunJulAugSepOctNovDecAnnual
20227.27.18.09.912.613.815.915.010.7
20215.06.77.99.010.413.317.516.415.211.99.37.610.9
20207.26.06.611.012.813.814.416.013.810.59.16.110.6
20196.98.47.910.211.713.116.315.513.710.37.17.110.7
LTA6.16.17.39.011.513.815.415.413.510.88.36.510.3

Mean 10cm soil temperature for NEWPORT at 0900 UTC

YearJanFebMarAprMayJunJulAugSepOctNovDecAnnual
20226.26.26.39.313.214.816.8n/a10.4
20213.65.06.88.210.914.317.916.315.211.38.66.610.4
20205.74.75.49.713.014.814.916.313.79.58.05.110.1
20196.16.16.88.912.213.816.715.713.59.46.25.610.1
LTAn/an/an/an/an/an/an/an/an/an/an/an/an/a

Global Solar Radiation in Joules/cm2 for NEWPORT

YearJanFebMarAprMayJunJulAugSepOctNovDecAnnual
20226311107563339940555515694724648439393238668
2021662013347203704569455690454884945540490224131635872353780326940
2020626310808245454619258476435374021540555255581848763195209326164
2019537810595213063764849884496074539537116264601740681674766313728
LTAn/an/an/an/an/an/an/an/an/an/an/an/an/a

Potential Evapotranspiration (mm) for NEWPORT

YearJanFebMarAprMayJunJulAugSepOctNovDecAnnual
202213.723.047.260.677.776.080.41.2379.8
20217.622.930.762.976.370.787.867.538.325.114.114.6518.5
202017.621.935.070.291.672.966.266.442.728.113.610.4536.6
201913.421.535.460.479.078.279.562.942.829.214.814.3531.4
LTAn/an/an/an/an/an/an/an/an/an/an/an/an/a

Evaporation (mm) for NEWPORT

YearJanFebMarAprMayJunJulAugSepOctNovDecAnnual
202217.932.466.586.8114.5109.2111.11.6540.0
202110.932.145.489.9111.2102.0117.293.552.134.718.619.1726.7
202022.431.951.898.9130.8104.894.392.759.138.818.113.6757.2
201917.729.552.087.3111.6112.8109.688.859.939.618.917.9745.6
LTAn/an/an/an/an/an/an/an/an/an/an/an/an/a

Degree Days Below 15.5 Degree Celsius for NEWPORT

YearJanFebMarAprMayJunJulAugSepOctNovDecTotal
2022256234235171976330N/AN/AN/AN/AN/AN/A
2021325247236200167792023401141872451883
2020257276275143111735531711561932911935
2019266200235165130892736671642512621892

Notes on the Data

Evaporation and PE data are calculated using Penman/Monteith formulae.
The ‘LTA’ (referred to within a table) is average for the climatological long-term-average (LTA) reference period 1981-2010.
Data updated daily at Mid-day.

Cumulative Rainfall Graphs

Temperature Departures from LTA