
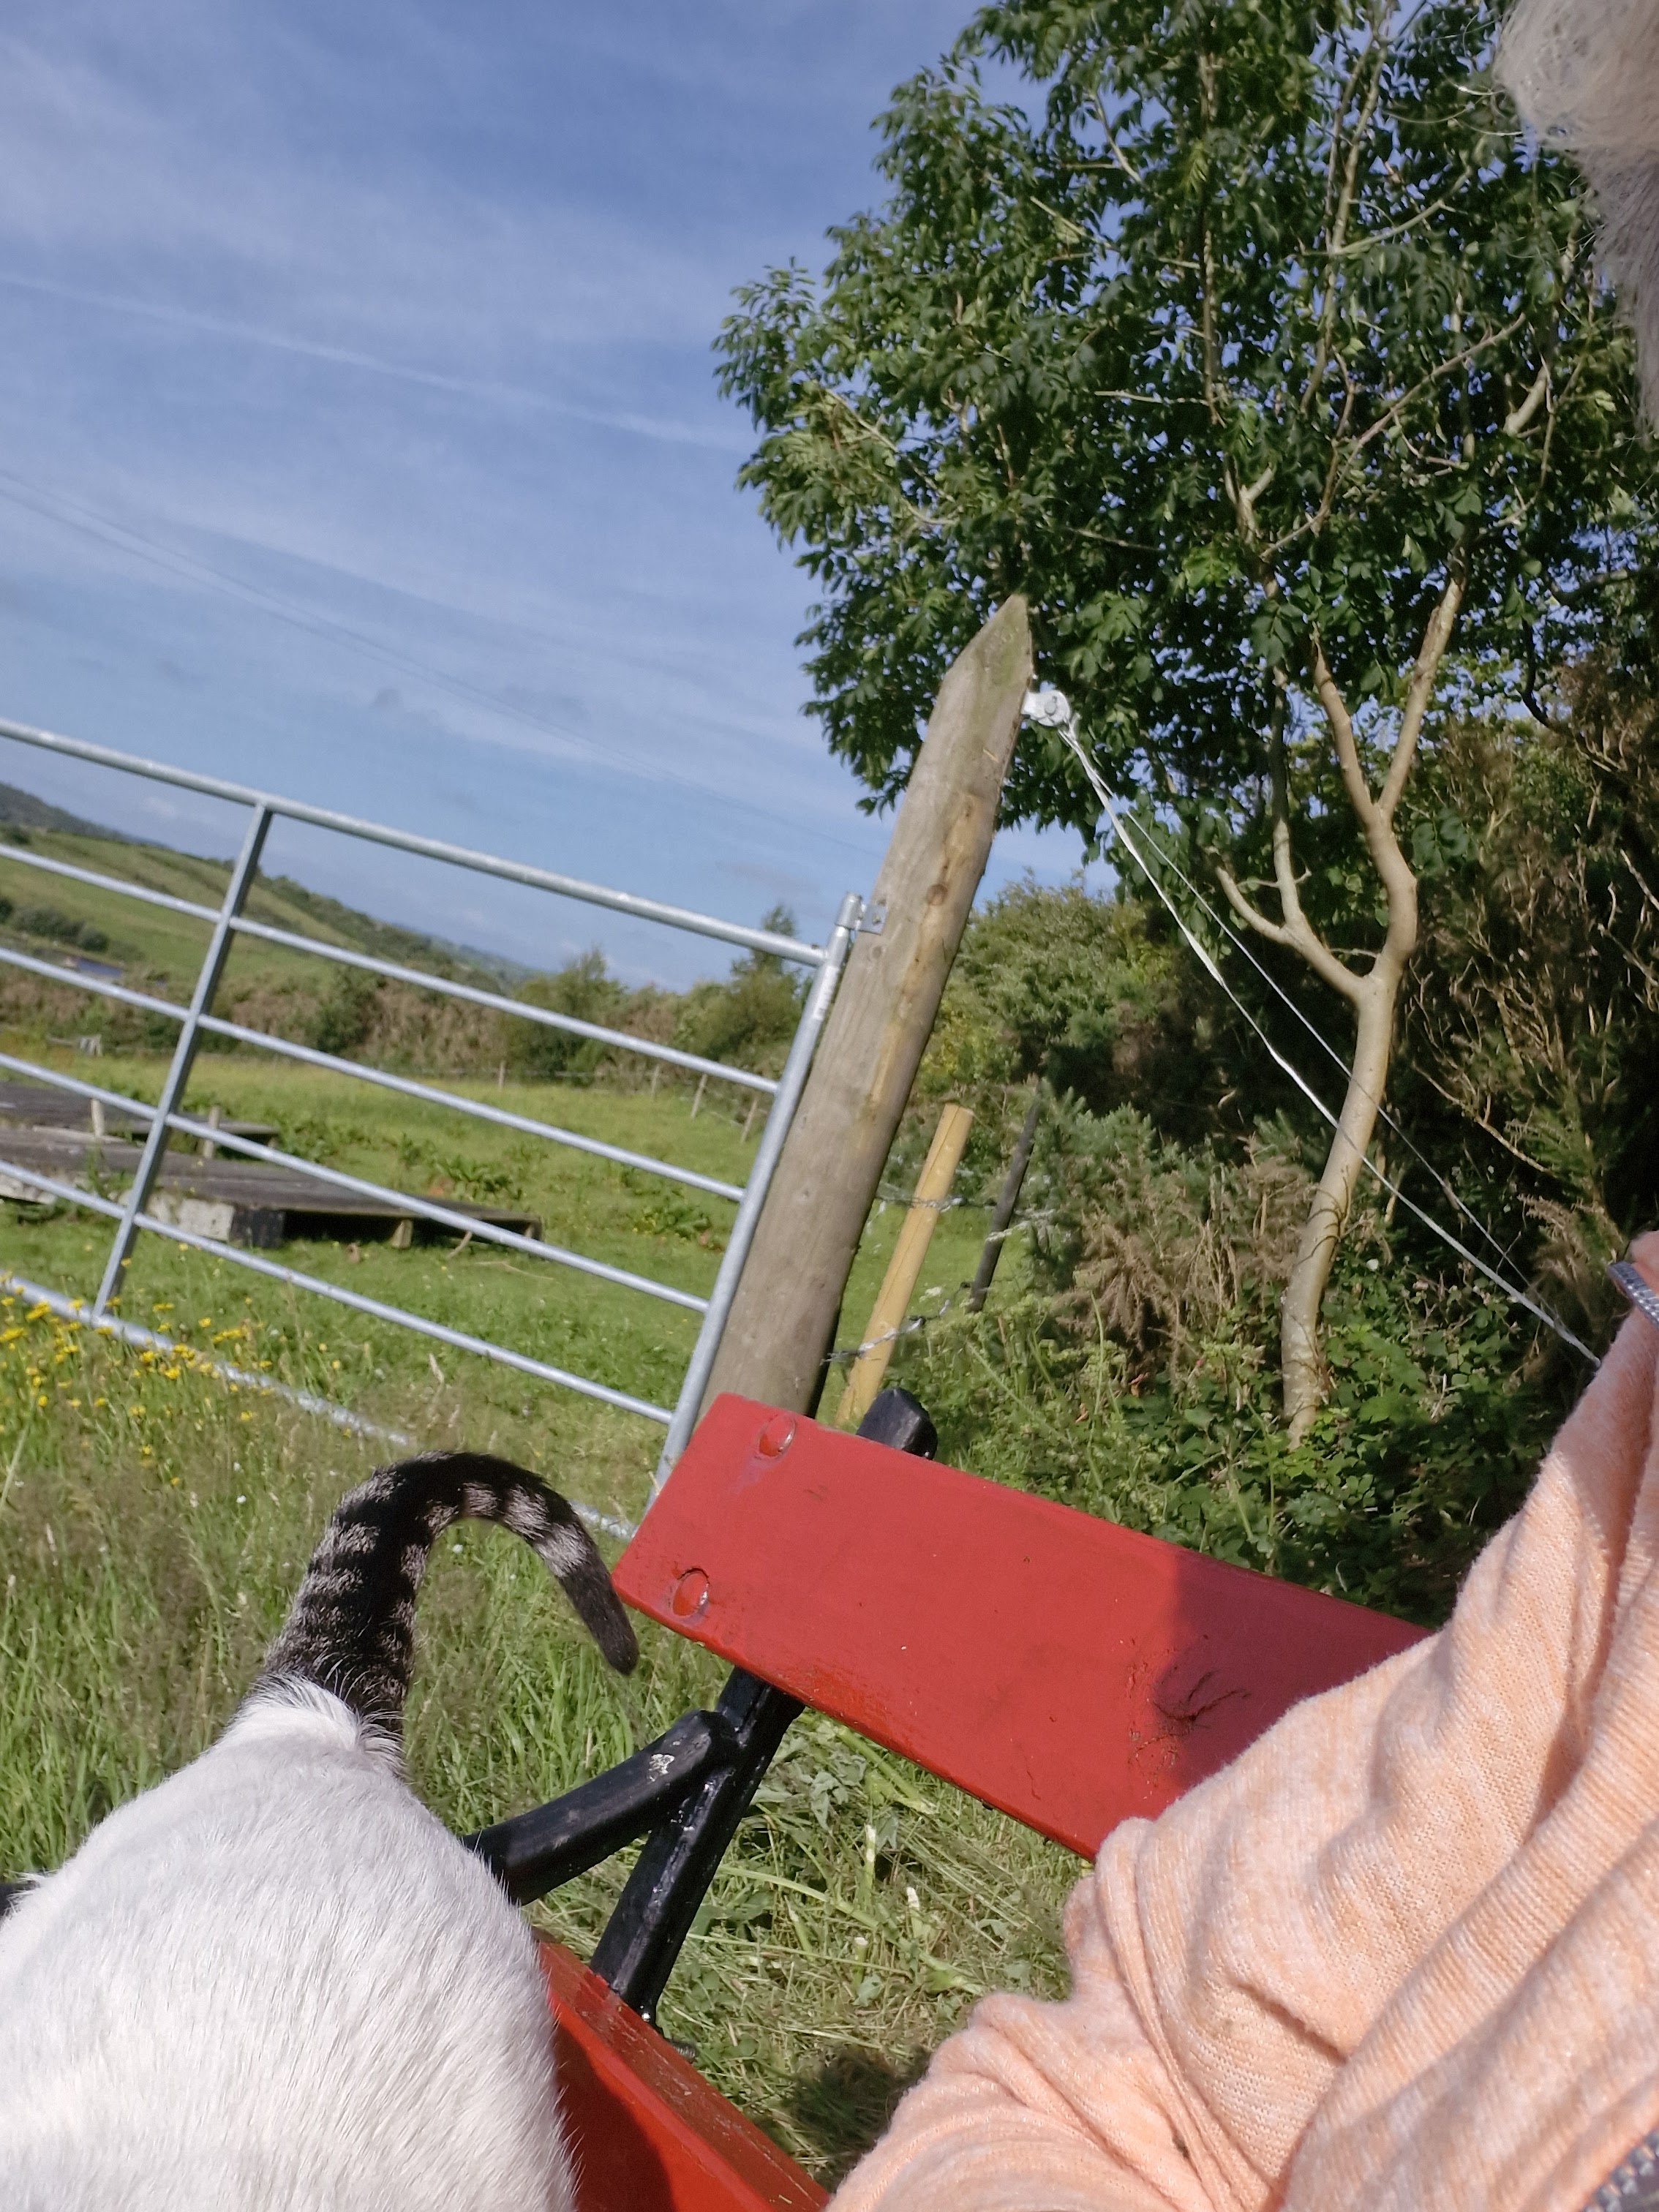
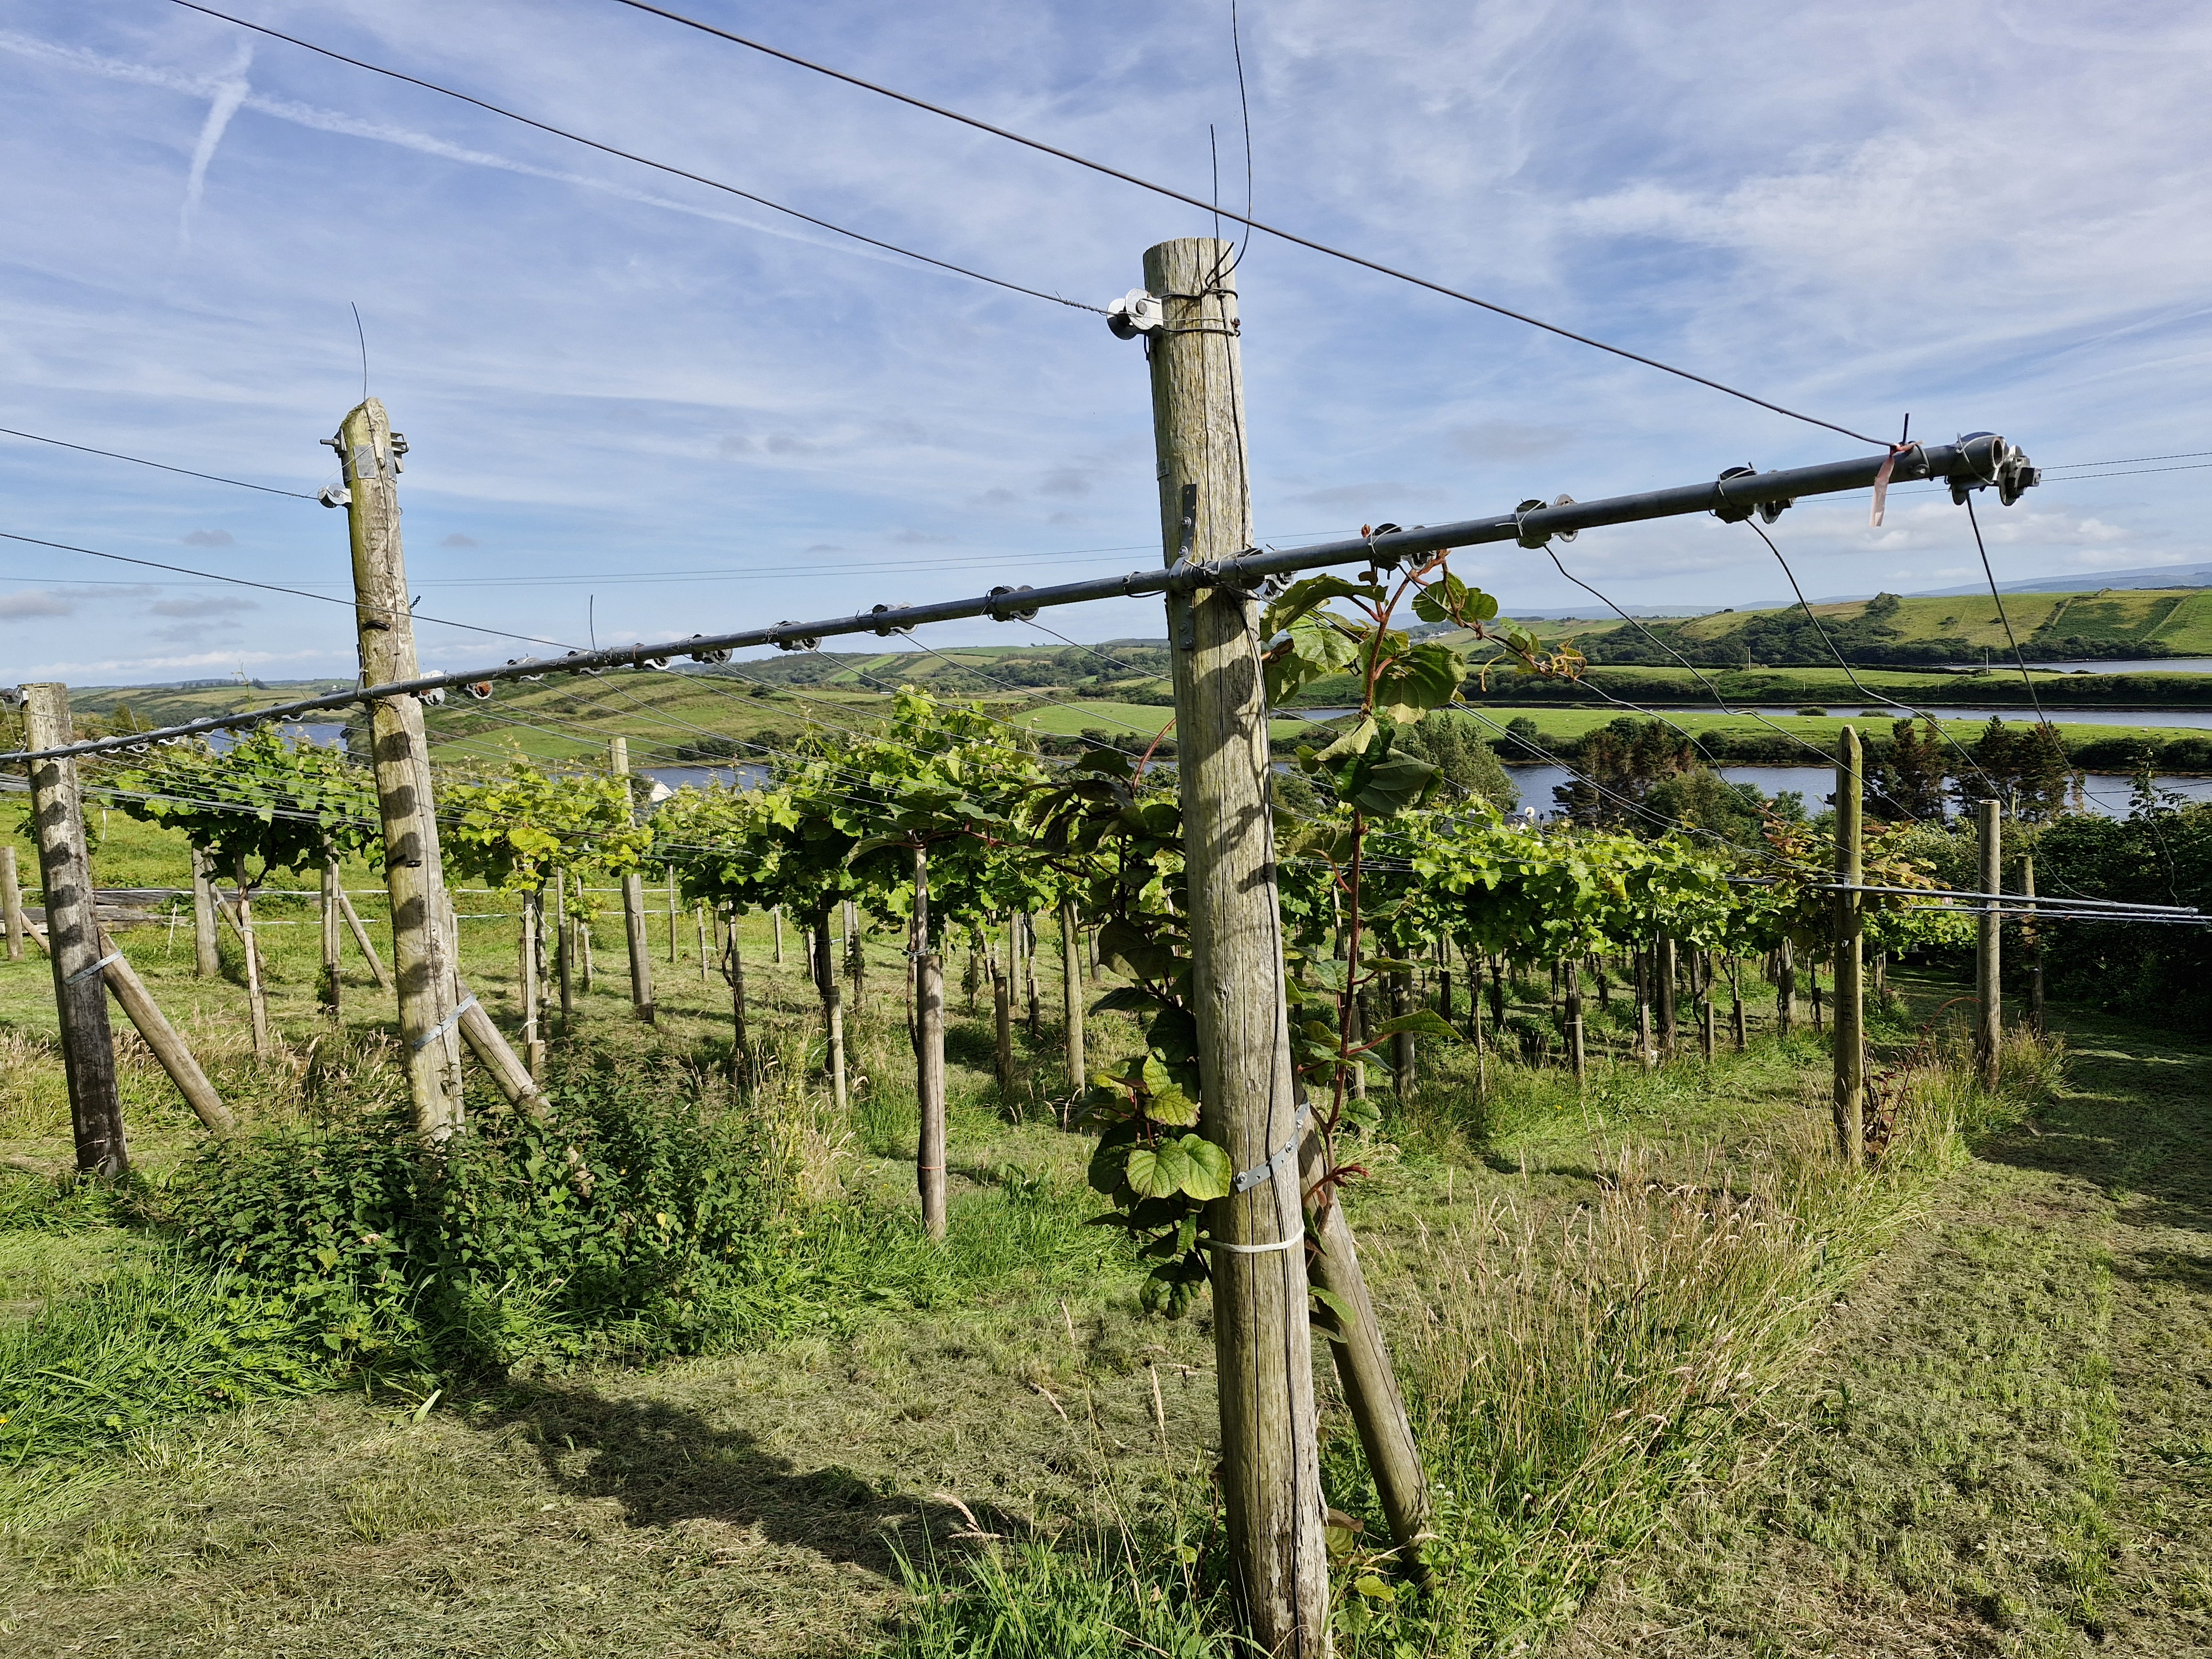
The weather is stunning this week. Whispy clouds, blue sky, gentle breeze, hot sun. The girls and I were seeking out the shade. The vineyard is thriving and growing towards the heavens.


The donkeys were sweet this morning. Ursula and Blanche were grooming each other. The boys were huggable. Treats were well received. Then we went off to our chores. I pruned the raspberry beds. Alex strimmed the vineyard between vines. It's looking good. I helped place some vines on the trellis. Ghostie took in the views. The new Rondos are doing well. We've only lost one. Life is good.


.png)
For the next week, we can expect consistent weather forecasts again. Temperatures in the 20s, little rain to speak of, minimal cloud cover, little wind, and lots of sun. They are warning us already that there's to be a shortage of water and many municipalities will be reducing flow. I think we are okay here with our private water scheme, but still, growing stuff without water is not easy. How weird is this?

Only if you use corks and not plastic-lined caps, a somewhat counterintuitive finding. This French study finds that contamination with microplastics (MPs) is higher in glass bottles with plastic caps than in plastic bottles. The MPs matched the plastic composition of the caps. The authors suggest that cap abrasion during storage drives contamination.
What about wine with screw caps that have a plastic liner? And why do sodas and lemonade have higher content than iced teas, which often also have lemon flavouring. This study raises more questions than it answers.

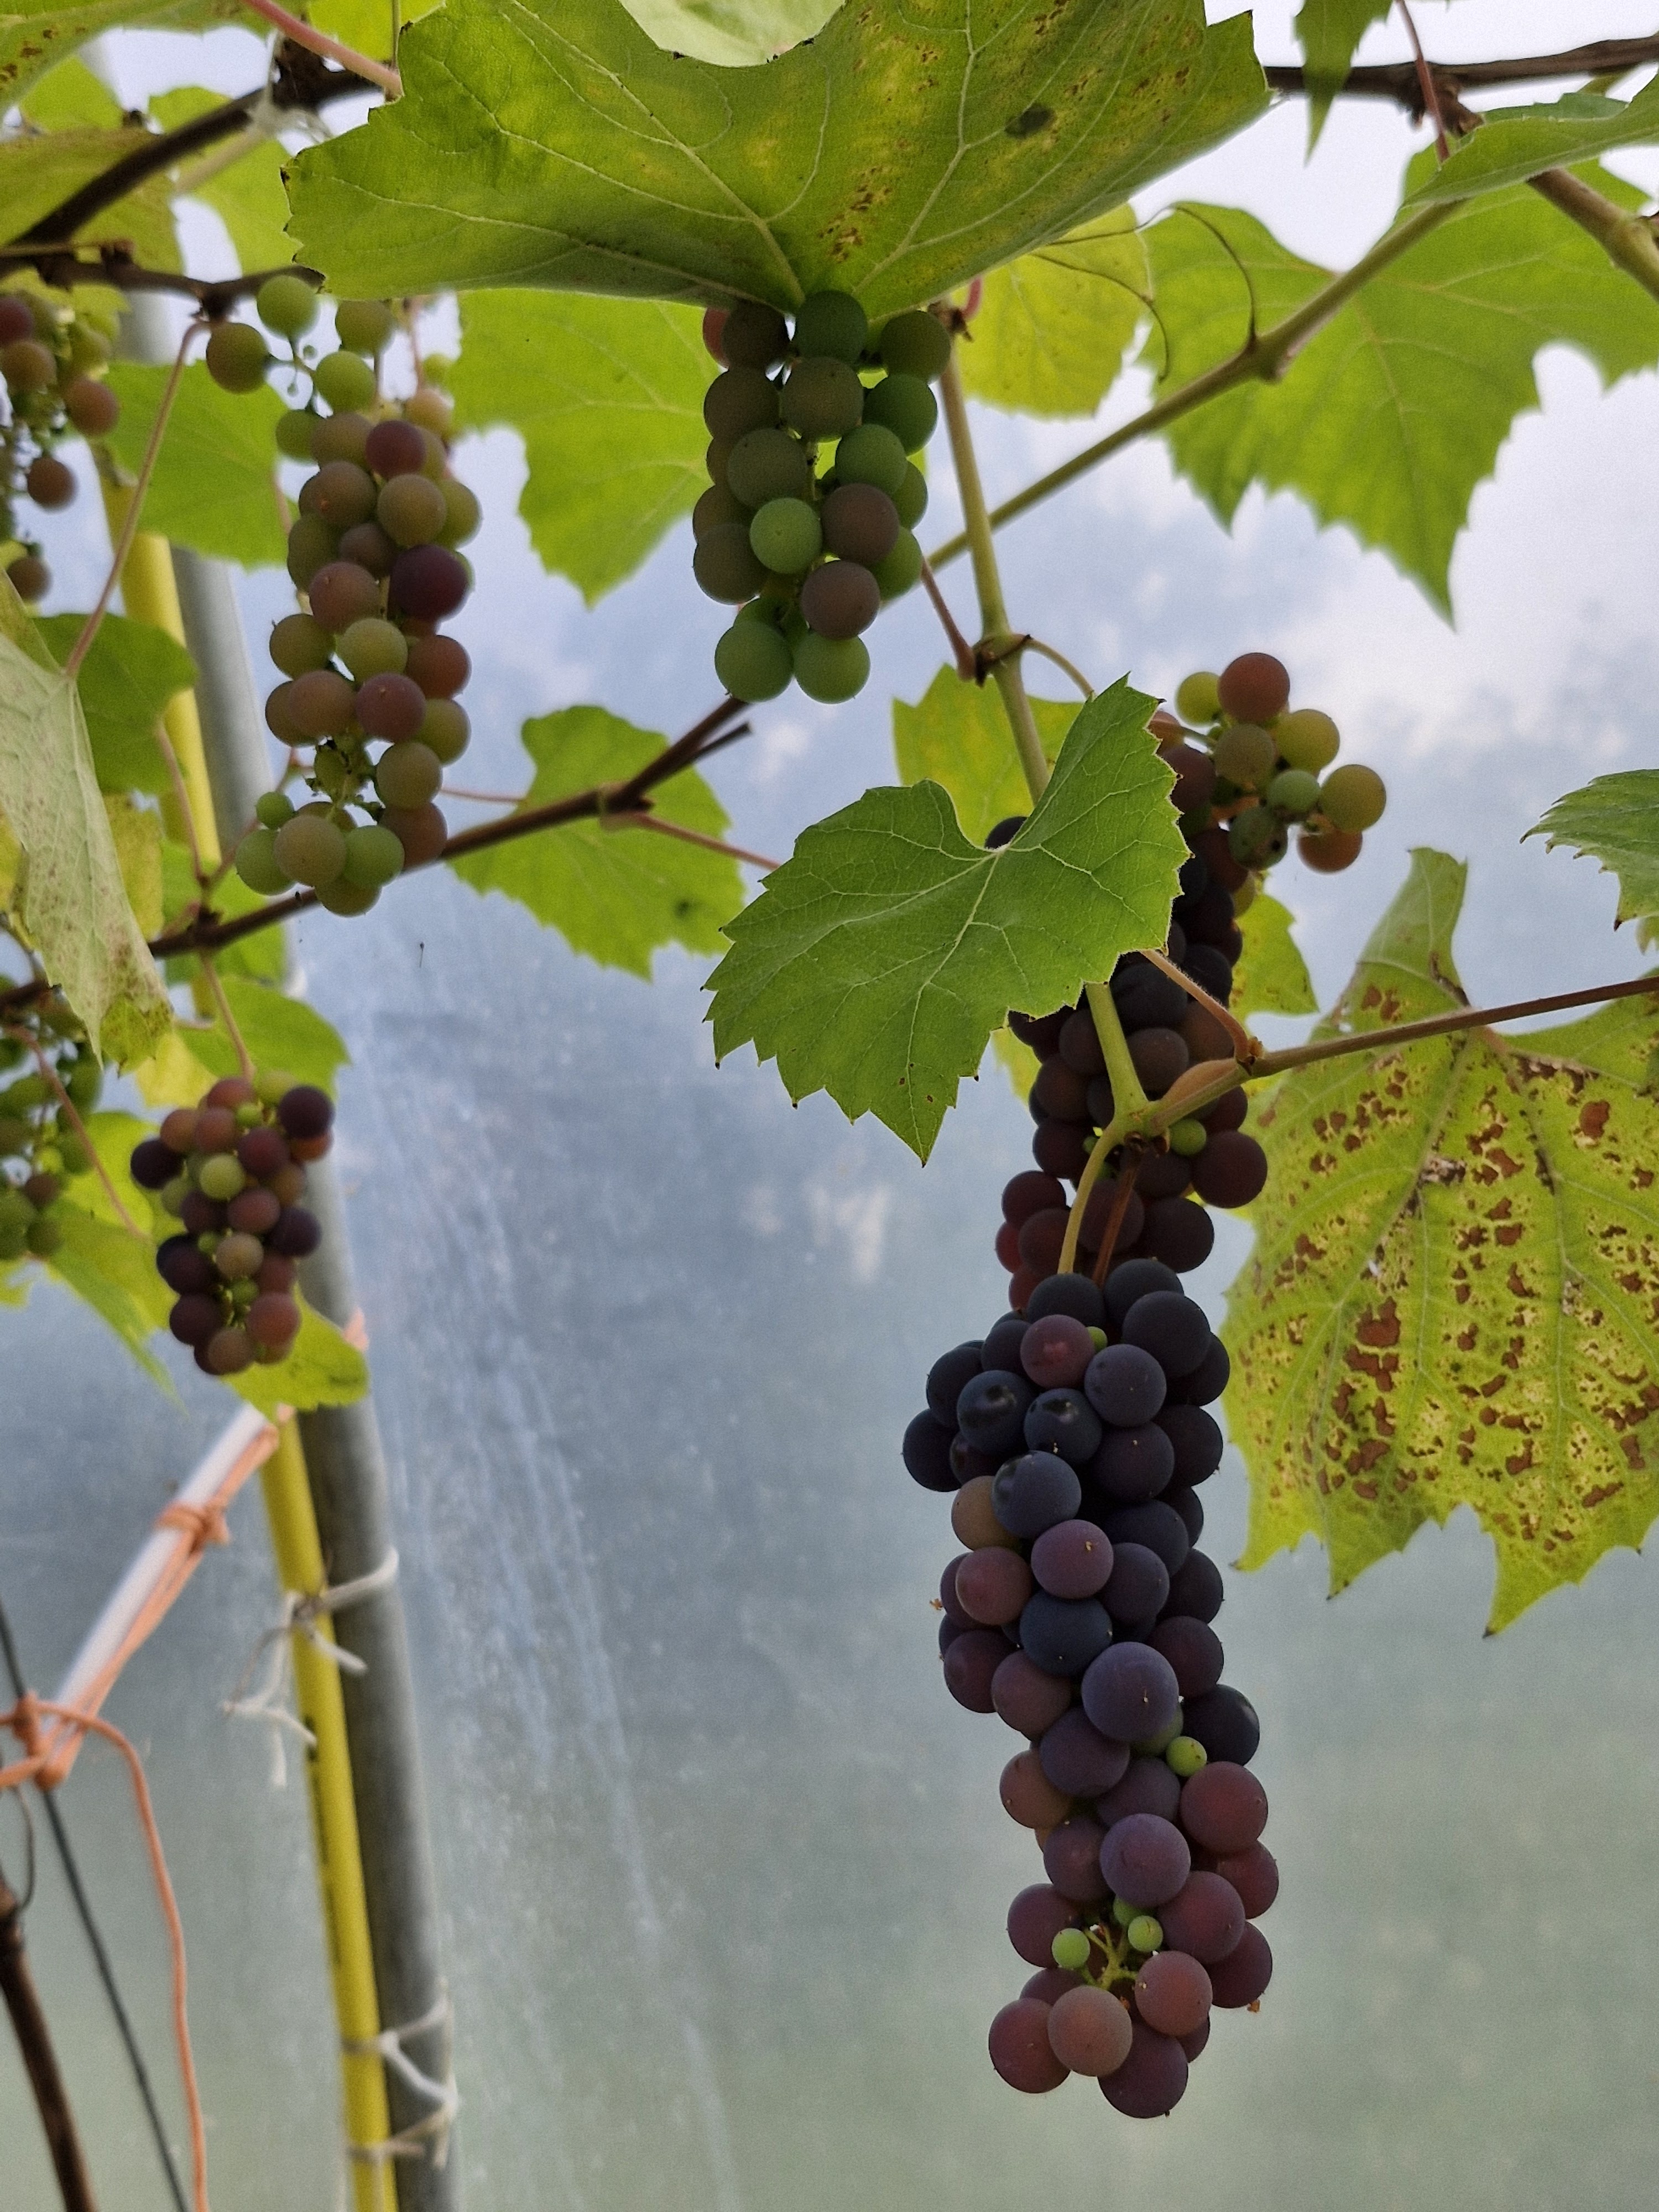
The grapes in the polytunnel are almost ready to pick. They've turned red very quickly since the start of veraison. But curiously, they are not the light red colour that they are in photos online. They are much darker red in colour. Below is what they are supposed to look like.
 |
| Future Forests' photo of Vanessa. |
We also have olives coming in the polytunnel. They are tiny and hard. You are supposed to pick them just as they start turning darker in colour. Sounds like preparing olives so they are edible can be quite honorous,


OCC Interviews: Daria Blackwell 2025
Simon Currin, Past Commodore of the Ocean Cruising Club, interviewed me about my back story and how I got into sailing and serving the OCC.
.png)
.png)