Wishing all my friends and family around the world a healthy and happy new year. Don't look back!
from

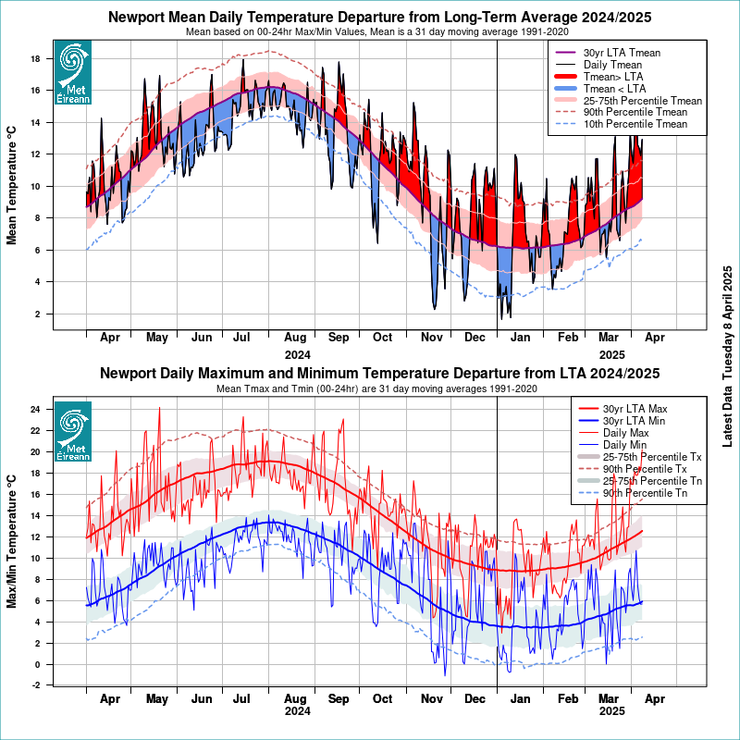
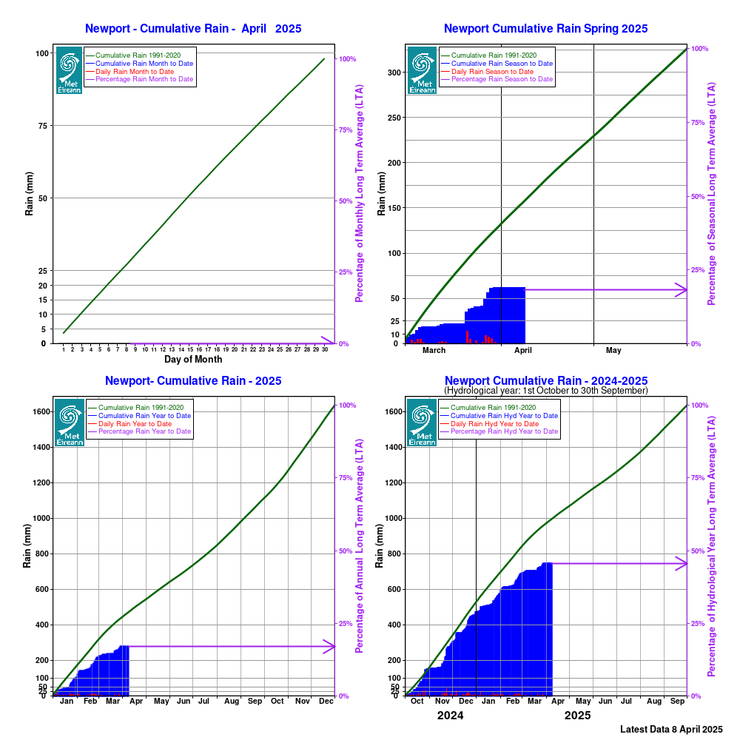
Here are the monthly stats for climate to the year-end. There is a consistent trend for temperature climbing upward over the past few years. December ended with an average amount of rainfall, but temperatures were at 7.6C more than a degree higher than Long Term Average (LTA) 6.5C. At 1725 mm for the year, we had more rainfall than the LTA 1607. At 10.9C, our average temperature for the year was higher than the LTA 10.3C.
We open the New Year with a gale today. Wind gusts up to 80 knots overnight kept me awake much of the night. The whole house was shaking as it is a SWerly gale - the direction in which we are most exposed. The MSC anemometer showed gusts over 77 knots (89 mph or 143 kph). The worst is now past us but it makes for an unpleasant beginning to 2022 (which sounds very science fiction).


MONTHLY VALUES FOR NEWPORT UP TO 31-DEC-2021
Total rainfall in millimetres for NEWPORT
| Year | Jan | Feb | Mar | Apr | May | Jun | Jul | Aug | Sep | Oct | Nov | Dec | Annual |
|---|---|---|---|---|---|---|---|---|---|---|---|---|---|
| -999 | n/a | ||||||||||||
| 2021 | 225.6 | 147.6 | 141.1 | 45.6 | 113.5 | 64.1 | 59.7 | 155.6 | 137.0 | 265.7 | 183.3 | 186.8 | 1725.6 |
| 2020 | 139.5 | 342.8 | 178.2 | 25.5 | 54.7 | 164.5 | 187.9 | 137.9 | 153.4 | 228.0 | 206.6 | 232.7 | 2051.7 |
| 2019 | 146.8 | 115.0 | 228.5 | 100.7 | 112.5 | 76.6 | 82.7 | 228.9 | 175.5 | 160.7 | 148.1 | 220.6 | 1796.6 |
| LTA | 166.7 | 126.5 | 141.2 | 96.8 | 94.7 | 89.7 | 100.9 | 132.5 | 131.5 | 176.0 | 170.4 | 180.2 | 1607.1 |
Mean temperature in degrees Celsius for NEWPORT
| Year | Jan | Feb | Mar | Apr | May | Jun | Jul | Aug | Sep | Oct | Nov | Dec | Annual |
|---|---|---|---|---|---|---|---|---|---|---|---|---|---|
| -999 | n/a | ||||||||||||
| 2021 | 5.0 | 6.7 | 7.9 | 9.0 | 10.4 | 13.3 | 17.5 | 16.4 | 15.2 | 11.9 | 9.3 | 7.6 | 10.9 |
| 2020 | 7.2 | 6.0 | 6.6 | 11.0 | 12.8 | 13.8 | 14.4 | 16.0 | 13.8 | 10.5 | 9.1 | 6.1 | 10.6 |
| 2019 | 6.9 | 8.4 | 7.9 | 10.2 | 11.7 | 13.1 | 16.3 | 15.5 | 13.7 | 10.3 | 7.1 | 7.1 | 10.7 |
| LTA | 6.1 | 6.1 | 7.3 | 9.0 | 11.5 | 13.8 | 15.4 | 15.4 | 13.5 | 10.8 | 8.3 | 6.5 | 10.3 |
Mean 10cm soil temperature for NEWPORT at 0900 UTC
| Year | Jan | Feb | Mar | Apr | May | Jun | Jul | Aug | Sep | Oct | Nov | Dec | Annual |
|---|---|---|---|---|---|---|---|---|---|---|---|---|---|
| 2022 | 5.6 | -214748368.0 | |||||||||||
| 2021 | 3.6 | 5.0 | 6.8 | 8.2 | 10.9 | 14.3 | 17.9 | 16.3 | 15.2 | 11.3 | 8.6 | 6.6 | 10.4 |
| 2020 | 5.7 | 4.7 | 5.4 | 9.7 | 13.0 | 14.8 | 14.9 | 16.3 | 13.7 | 9.5 | 8.0 | 5.1 | 10.1 |
| 2019 | 6.1 | 6.1 | 6.8 | 8.9 | 12.2 | 13.8 | 16.7 | 15.7 | 13.5 | 9.4 | 6.2 | 5.6 | 10.1 |
| LTA | n/a | n/a | n/a | n/a | n/a | n/a | n/a | n/a | n/a | n/a | n/a | n/a | n/a |
Global Solar Radiation in Joules/cm2 for NEWPORT
| Year | Jan | Feb | Mar | Apr | May | Jun | Jul | Aug | Sep | Oct | Nov | Dec | Annual |
|---|---|---|---|---|---|---|---|---|---|---|---|---|---|
| -999 | n/a | ||||||||||||
| 2021 | 6620 | 13347 | 20370 | 45694 | 55690 | 45488 | 49455 | 40490 | 22413 | 16358 | 7235 | 3780 | 326940 |
| 2020 | 6263 | 10808 | 24545 | 46192 | 58476 | 43537 | 40215 | 40555 | 25558 | 18487 | 6319 | 5209 | 326164 |
| 2019 | 5378 | 10595 | 21306 | 37648 | 49884 | 49607 | 45395 | 37116 | 26460 | 17406 | 8167 | 4766 | 313728 |
| LTA | n/a | n/a | n/a | n/a | n/a | n/a | n/a | n/a | n/a | n/a | n/a | n/a | n/a |
Potential Evapotranspiration (mm) for NEWPORT
| Year | Jan | Feb | Mar | Apr | May | Jun | Jul | Aug | Sep | Oct | Nov | Dec | Annual |
|---|---|---|---|---|---|---|---|---|---|---|---|---|---|
| -999 | n/a | ||||||||||||
| 2021 | 7.6 | 22.9 | 30.7 | 62.9 | 76.3 | 70.7 | 87.8 | 67.5 | 38.3 | 25.1 | 14.1 | 14.6 | 518.5 |
| 2020 | 17.6 | 21.9 | 35.0 | 70.2 | 91.6 | 72.9 | 66.2 | 66.4 | 42.7 | 28.1 | 13.6 | 10.4 | 536.6 |
| 2019 | 13.4 | 21.5 | 35.4 | 60.4 | 79.0 | 78.2 | 79.5 | 62.9 | 42.8 | 29.2 | 14.8 | 14.3 | 531.4 |
| LTA | n/a | n/a | n/a | n/a | n/a | n/a | n/a | n/a | n/a | n/a | n/a | n/a | n/a |
Evaporation (mm) for NEWPORT
| Year | Jan | Feb | Mar | Apr | May | Jun | Jul | Aug | Sep | Oct | Nov | Dec | Annual |
|---|---|---|---|---|---|---|---|---|---|---|---|---|---|
| -999 | n/a | ||||||||||||
| 2021 | 10.9 | 32.1 | 45.4 | 89.9 | 111.2 | 102.0 | 117.2 | 93.5 | 52.1 | 34.7 | 18.6 | 19.1 | 726.7 |
| 2020 | 22.4 | 31.9 | 51.8 | 98.9 | 130.8 | 104.8 | 94.3 | 92.7 | 59.1 | 38.8 | 18.1 | 13.6 | 757.2 |
| 2019 | 17.7 | 29.5 | 52.0 | 87.3 | 111.6 | 112.8 | 109.6 | 88.8 | 59.9 | 39.6 | 18.9 | 17.9 | 745.6 |
| LTA | n/a | n/a | n/a | n/a | n/a | n/a | n/a | n/a | n/a | n/a | n/a | n/a | n/a |
DEGREE DAYS BELOW 15.5 DEGREE CELSIUS FOR NEWPORT
| Year | Jan | Feb | Mar | Apr | May | Jun | Jul | Aug | Sep | Oct | Nov | Dec | Total |
|---|---|---|---|---|---|---|---|---|---|---|---|---|---|
| 2021 | 325 | 247 | 236 | 200 | 167 | 79 | 20 | 23 | 40 | 114 | 187 | 245 | 1883 |
| 2020 | 257 | 276 | 275 | 143 | 111 | 73 | 55 | 31 | 71 | 156 | 193 | 291 | 1935 |
| 2019 | 266 | 200 | 235 | 165 | 130 | 89 | 27 | 36 | 67 | 164 | 251 | 262 | 1892 |
| 2018 | 298 | 306 | 309 | 194 | 104 | 50 | 31 | 44 | 100 | 147 | 215 | 230 | 2027 |
Notes on the Data
Evaporation and PE data are calculated using Penman/Monteith formulae.
The ‘LTA’ (referred to within a table) is average for the climatological long-term-average (LTA) reference period 1981-2010.
Data updated daily at Mid-day.
CUMULATIVE RAINFALL GRAPHS
TEMPERATURE DEPARTURES FROM LTA