I re-tested the red Rondo grapes and got consistent readings of 17. I tried testing the Solaris but got nothing. The Chardonnay grapes don't appear to be anywhere near veraison although it's hard for the untrained eye to discern veraison in white grapes.
It's hot again today, forecast to reach 18C, but it's much hotter than that in the sun. There has been little rainfall, but we're expecting potentially heavy rain tomorrow and daily for the next week. The Pinot Noir vines are showing stress (yellow leaves) and the Albarino is stunted in growth again. I'm afraid that when the rain does come, it will shock the grapes and dilute the juices which at the moment are delicious and concentrated.
 |
| Rondo getting close |
 |
| Pinot Noir nowhere near |
 |
| Chardonnay vines showing effects of drought |
 |
| Albarino stunted |
 |
| 7 yo vines doing just fine |
Monthly values for NEWPORT up to 31-aug-2022
Total rainfall in millimetres for NEWPORT
| Year | Jan | Feb | Mar | Apr | May | Jun | Jul | Aug | Sep | Oct | Nov | Dec | Annual |
|---|
| 2022 | 98.8 | 260.4 | 67.8 | 84.0 | 107.0 | 148.0 | 59.2 | 104.1 | n/a | | | | 929.3 |
| 2021 | 225.6 | 147.6 | 141.1 | 45.6 | 113.5 | 64.1 | 59.7 | 155.6 | 137.0 | 265.7 | 183.3 | 186.6 | 1725.4 |
| 2020 | 139.5 | 342.8 | 178.2 | 25.5 | 54.7 | 164.5 | 187.9 | 137.9 | 153.4 | 228.0 | 206.6 | 232.7 | 2051.7 |
| 2019 | 146.8 | 115.0 | 228.5 | 100.7 | 112.5 | 76.6 | 82.7 | 228.9 | 175.5 | 160.7 | 148.1 | 220.6 | 1796.6 |
| LTA | 166.7 | 126.5 | 141.2 | 96.8 | 94.7 | 89.7 | 100.9 | 132.5 | 131.5 | 176.0 | 170.4 | 180.2 | 1607.1 |
Mean temperature in degrees Celsius for NEWPORT
| Year | Jan | Feb | Mar | Apr | May | Jun | Jul | Aug | Sep | Oct | Nov | Dec | Annual |
|---|
| 2022 | 7.2 | 7.1 | 8.0 | 9.9 | 12.6 | 13.8 | 15.9 | 16.2 | n/a | | | | 11.4 |
| 2021 | 5.0 | 6.7 | 7.9 | 9.0 | 10.4 | 13.3 | 17.5 | 16.4 | 15.2 | 11.9 | 9.3 | 7.6 | 10.9 |
| 2020 | 7.2 | 6.0 | 6.6 | 11.0 | 12.8 | 13.8 | 14.4 | 16.0 | 13.8 | 10.5 | 9.1 | 6.1 | 10.6 |
| 2019 | 6.9 | 8.4 | 7.9 | 10.2 | 11.7 | 13.1 | 16.3 | 15.5 | 13.7 | 10.3 | 7.1 | 7.1 | 10.7 |
| LTA | 6.1 | 6.1 | 7.3 | 9.0 | 11.5 | 13.8 | 15.4 | 15.4 | 13.5 | 10.8 | 8.3 | 6.5 | 10.3 |
Mean 10cm soil temperature for NEWPORT at 0900 UTC
| Year | Jan | Feb | Mar | Apr | May | Jun | Jul | Aug | Sep | Oct | Nov | Dec | Annual |
|---|
| 2022 | 6.2 | 6.2 | 6.3 | 9.3 | 13.2 | 14.8 | 16.8 | 16.6 | n/a | | | | 11.2 |
| 2021 | 3.6 | 5.0 | 6.8 | 8.2 | 10.9 | 14.3 | 17.9 | 16.3 | 15.2 | 11.3 | 8.6 | 6.6 | 10.4 |
| 2020 | 5.7 | 4.7 | 5.4 | 9.7 | 13.0 | 14.8 | 14.9 | 16.3 | 13.7 | 9.5 | 8.0 | 5.1 | 10.1 |
| 2019 | 6.1 | 6.1 | 6.8 | 8.9 | 12.2 | 13.8 | 16.7 | 15.7 | 13.5 | 9.4 | 6.2 | 5.6 | 10.1 |
| LTA | n/a | n/a | n/a | n/a | n/a | n/a | n/a | n/a | n/a | n/a | n/a | n/a | n/a |
Global Solar Radiation in Joules/cm2 for NEWPORT
| Year | Jan | Feb | Mar | Apr | May | Jun | Jul | Aug | Sep | Oct | Nov | Dec | Annual |
|---|
| 2022 | 6311 | 10756 | 33399 | 40555 | 51569 | 47246 | 48439 | 51169 | n/a | | | | 289444 |
| 2021 | 6620 | 13347 | 20370 | 45694 | 55690 | 45488 | 49455 | 40490 | 22413 | 16358 | 7235 | 3780 | 326940 |
| 2020 | 6263 | 10808 | 24545 | 46192 | 58476 | 43537 | 40215 | 40555 | 25558 | 18487 | 6319 | 5209 | 326164 |
| 2019 | 5378 | 10595 | 21306 | 37648 | 49884 | 49607 | 45395 | 37116 | 26460 | 17406 | 8167 | 4766 | 313728 |
| LTA | n/a | n/a | n/a | n/a | n/a | n/a | n/a | n/a | n/a | n/a | n/a | n/a | n/a |
Potential Evapotranspiration (mm) for NEWPORT
| Year | Jan | Feb | Mar | Apr | May | Jun | Jul | Aug | Sep | Oct | Nov | Dec | Annual |
|---|
| 2022 | 13.7 | 23.0 | 47.2 | 60.6 | 77.7 | 76.0 | 80.4 | 82.0 | n/a | | | | 460.6 |
| 2021 | 7.6 | 22.9 | 30.7 | 62.9 | 76.3 | 70.7 | 87.8 | 67.5 | 38.3 | 25.1 | 14.1 | 14.6 | 518.5 |
| 2020 | 17.6 | 21.9 | 35.0 | 70.2 | 91.6 | 72.9 | 66.2 | 66.4 | 42.7 | 28.1 | 13.6 | 10.4 | 536.6 |
| 2019 | 13.4 | 21.5 | 35.4 | 60.4 | 79.0 | 78.2 | 79.5 | 62.9 | 42.8 | 29.2 | 14.8 | 14.3 | 531.4 |
| LTA | n/a | n/a | n/a | n/a | n/a | n/a | n/a | n/a | n/a | n/a | n/a | n/a | n/a |
Evaporation (mm) for NEWPORT
| Year | Jan | Feb | Mar | Apr | May | Jun | Jul | Aug | Sep | Oct | Nov | Dec | Annual |
|---|
| 2022 | 17.9 | 32.4 | 66.5 | 86.8 | 114.5 | 109.2 | 111.1 | 113.2 | n/a | | | | 651.6 |
| 2021 | 10.9 | 32.1 | 45.4 | 89.9 | 111.2 | 102.0 | 117.2 | 93.5 | 52.1 | 34.7 | 18.6 | 19.1 | 726.7 |
| 2020 | 22.4 | 31.9 | 51.8 | 98.9 | 130.8 | 104.8 | 94.3 | 92.7 | 59.1 | 38.8 | 18.1 | 13.6 | 757.2 |
| 2019 | 17.7 | 29.5 | 52.0 | 87.3 | 111.6 | 112.8 | 109.6 | 88.8 | 59.9 | 39.6 | 18.9 | 17.9 | 745.6 |
| LTA | n/a | n/a | n/a | n/a | n/a | n/a | n/a | n/a | n/a | n/a | n/a | n/a | n/a |
Degree Days Below 15.5 Degree Celsius for NEWPORT
|
| Year | Jan | Feb | Mar | Apr | May | Jun | Jul | Aug | Sep | Oct | Nov | Dec | Total |
|---|
| 2022 | 256 | 234 | 235 | 171 | 97 | 63 | 30 | 28 | N/A | N/A | N/A | N/A | N/A |
| 2021 | 325 | 247 | 236 | 200 | 167 | 79 | 20 | 23 | 40 | 114 | 187 | 245 | 1883 |
| 2020 | 257 | 276 | 275 | 143 | 111 | 73 | 55 | 31 | 71 | 156 | 193 | 291 | 1935 |
| 2019 | 266 | 200 | 235 | 165 | 130 | 89 | 27 | 36 | 67 | 164 | 251 | 262 | 1892 |
Notes on the Data
Evaporation and PE data are calculated using Penman/Monteith formulae.
The ‘LTA’ (referred to within a table) is average for the climatological long-term-average (LTA) reference period 1981-2010.
Data updated daily at Mid-day.
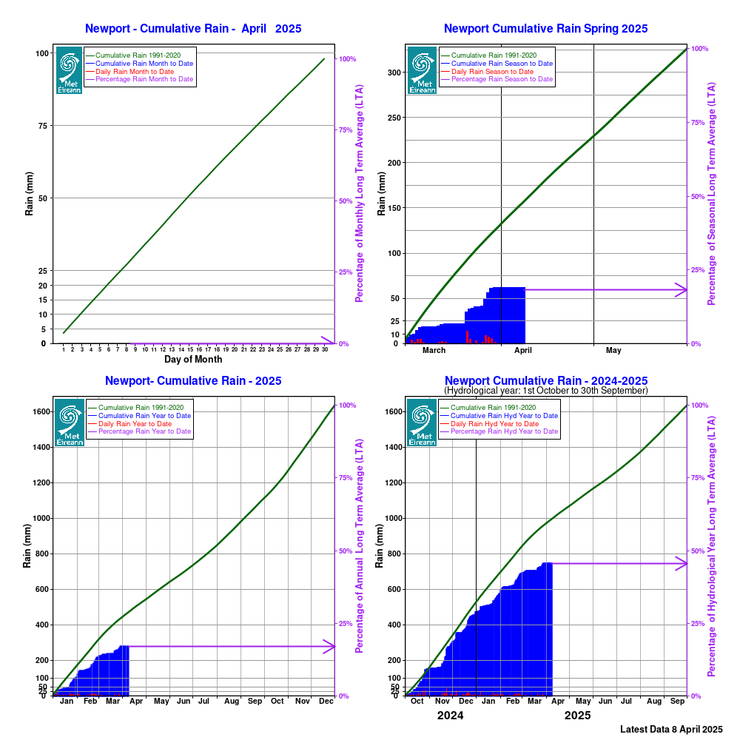
Cumulative Rainfall Graphs
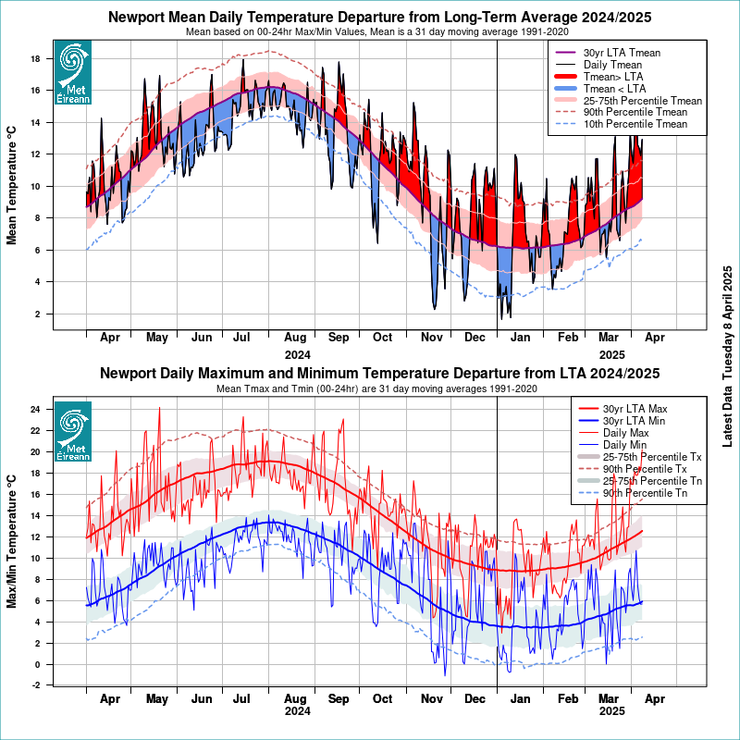
Temperature Departures from LTA