Showing posts with label rain. Show all posts

Friday, 23 June 2023

Atlantic Tropical Storms


For the first time on record, we've had two tropical storms form east of the Lesser Antilles in June: Bret and Cindy

The water on Achill Island is the warmest it's been over a ten-year average. The water in Cork is almost equal to the air temperature. And the water over the North Atlantic just keeps heating up. The sea surface temperature anomalies off the NW coast of Ireland and NE coast of GB are Scary! 

Meanwhile, it's still warm here and raining steadily at the moment. I hope it stops for the St John's night pig roast at the Quinns. 


today
yesterday
minimum
maximum
weather
17.1°C
17°C
10.5°C
16°C
19°C 
17.6°C
17.7°C
11.2°C
17.3°C
18°C 
WaterWeatherWave
Cork18.5°C19°C1.69 m
Ardmore18.3°C19°C1.48 m
Rossbeigh Strand18.2°C20°C0.48 m
Garryvoe18.2°C19°C1.43 m
Inch Beach18.2°C20°C0.48 m


💖

Saturday, 20 August 2022

Rain!

End poles are braced

The heatwave finally broke a couple of days ago and we had three partial days of rain. This morning it was coming down in buckets. You can feel the earth sigh with relief. With the earth a bit softer again, Alex was able to install the braces for the end poles and cement them in. 

We lost two vines to the heat and drought, both Chardonnay. I will root cuttings from the five year old vines. It seems that just sticking them in the ground works just fine. Forget about rootstock. The other vines have suffered a bit -- a few shrivelled leaves here and there -- but overall not too bad. I'm just glad we didn't have the conditions they had on the continent. Horrible sudden storms, over 220 kph winds, destructive hail, and torrential rain tore from Spain across the Med and into Italy and Austria. The rest of the continent is suffering from drought and heat -- the Danube is down 5 feet, Lake Como is unrecognizable. Many crops were destroyed by either drought or storms. It is feeling apocalyptic. 

Meanwhile, our grapes are now increasing in size and the Rondo continues to turn red. The Pinot Noir are still tiny and fuzzy, I'm not certain what that means. I hope it's not fungus, but the dry weather would indicate not. The Chardonnay have a few clusters, so we will mix whites this year. The Solaris are coming along but not in huge quantities as expected. All in all, it's pretty remarkable. 

I told our story to a woman from Harvard named Sinéad O'Connor, who comes home to Ireland and writes for The Currency. She is writing about the vineyards in Ireland. She heard about us from Colm McCan who teaches about wine at the Ballymaloe cookery school and has a small vineyard in East Cork close to Cloyne. The word is getting out. I guess now we need to start making serious wine. 

View over what looks like a vineyard now

View from the new picnic platform

Dead Chardonnay vine

Sun dappled leaves

View from the East

Monkey puzzle log bee hive

Rondo looking good

2 yo Pinot Noir vines bearing fruit

Chardonnay - very small

7 yo Solaris

4 yo Solaris - drought damage to leaves

More Rondo - veraison has begun!


Tuesday, 2 August 2022

July weather


So July ended with the same rainfall as last year but 1.6 degrees cooler. Note that August 1, in one day, we had almost as much rain as we had the entire month of July. That's caused the grapes to swell rather quickly and they are noticeably bigger today than on Saturday. 


Meanwhile, Cathal Keane has arrived to begin work on the construction of the trellis structure that will support the remaining vines as they mature. Today, he is digging the holes for the uprights -- telephone poles discarded as they are replaced in our area. Tomorrow, they begin cementing in the poles in the holes. It's a big job. 


Monthly values for NEWPORT up to 01-aug-2022

Total rainfall in millimetres for NEWPORT

YearJanFebMarAprMayJunJulAugSepOctNovDecAnnual
202298.8260.467.884.0107.0148.059.247.5872.7
2021225.6147.6141.145.6113.564.159.7155.6137.0265.7183.3186.61725.4
2020139.5342.8178.225.554.7164.5187.9137.9153.4228.0206.6232.72051.7
2019146.8115.0228.5100.7112.576.682.7228.9175.5160.7148.1220.61796.6
LTA166.7126.5141.296.894.789.7100.9132.5131.5176.0170.4180.21607.1

Mean temperature in degrees Celsius for NEWPORT

YearJanFebMarAprMayJunJulAugSepOctNovDecAnnual
20227.27.18.09.912.613.815.915.010.7
20215.06.77.99.010.413.317.516.415.211.99.37.610.9
20207.26.06.611.012.813.814.416.013.810.59.16.110.6
20196.98.47.910.211.713.116.315.513.710.37.17.110.7
LTA6.16.17.39.011.513.815.415.413.510.88.36.510.3

Mean 10cm soil temperature for NEWPORT at 0900 UTC

YearJanFebMarAprMayJunJulAugSepOctNovDecAnnual
20226.26.26.39.313.214.816.8n/a10.4
20213.65.06.88.210.914.317.916.315.211.38.66.610.4
20205.74.75.49.713.014.814.916.313.79.58.05.110.1
20196.16.16.88.912.213.816.715.713.59.46.25.610.1
LTAn/an/an/an/an/an/an/an/an/an/an/an/an/a

Global Solar Radiation in Joules/cm2 for NEWPORT

YearJanFebMarAprMayJunJulAugSepOctNovDecAnnual
20226311107563339940555515694724648439393238668
2021662013347203704569455690454884945540490224131635872353780326940
2020626310808245454619258476435374021540555255581848763195209326164
2019537810595213063764849884496074539537116264601740681674766313728
LTAn/an/an/an/an/an/an/an/an/an/an/an/an/a

Potential Evapotranspiration (mm) for NEWPORT

YearJanFebMarAprMayJunJulAugSepOctNovDecAnnual
202213.723.047.260.677.776.080.41.2379.8
20217.622.930.762.976.370.787.867.538.325.114.114.6518.5
202017.621.935.070.291.672.966.266.442.728.113.610.4536.6
201913.421.535.460.479.078.279.562.942.829.214.814.3531.4
LTAn/an/an/an/an/an/an/an/an/an/an/an/an/a

Evaporation (mm) for NEWPORT

YearJanFebMarAprMayJunJulAugSepOctNovDecAnnual
202217.932.466.586.8114.5109.2111.11.6540.0
202110.932.145.489.9111.2102.0117.293.552.134.718.619.1726.7
202022.431.951.898.9130.8104.894.392.759.138.818.113.6757.2
201917.729.552.087.3111.6112.8109.688.859.939.618.917.9745.6
LTAn/an/an/an/an/an/an/an/an/an/an/an/an/a

Degree Days Below 15.5 Degree Celsius for NEWPORT

YearJanFebMarAprMayJunJulAugSepOctNovDecTotal
2022256234235171976330N/AN/AN/AN/AN/AN/A
2021325247236200167792023401141872451883
2020257276275143111735531711561932911935
2019266200235165130892736671642512621892

Notes on the Data

Evaporation and PE data are calculated using Penman/Monteith formulae.
The ‘LTA’ (referred to within a table) is average for the climatological long-term-average (LTA) reference period 1981-2010.
Data updated daily at Mid-day.

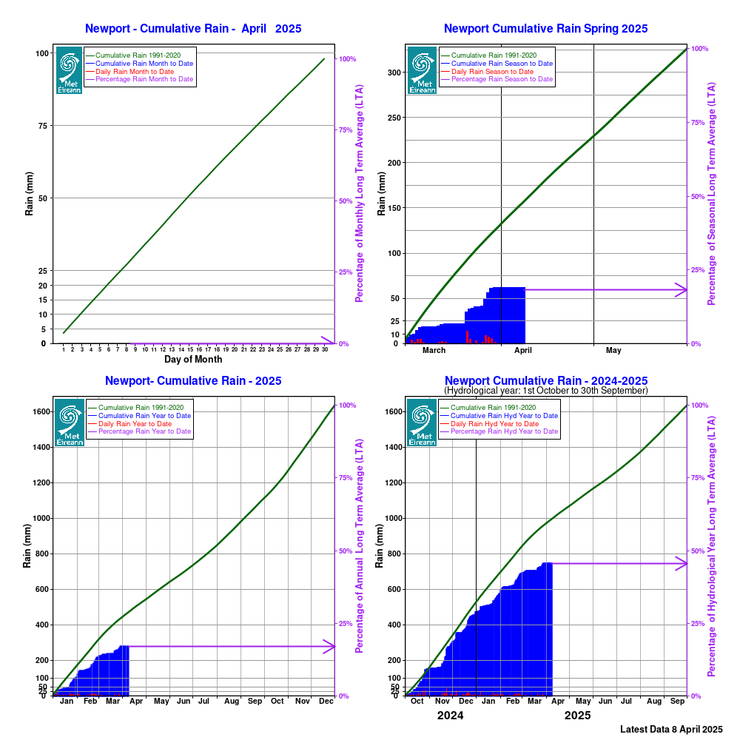
Cumulative Rainfall Graphs

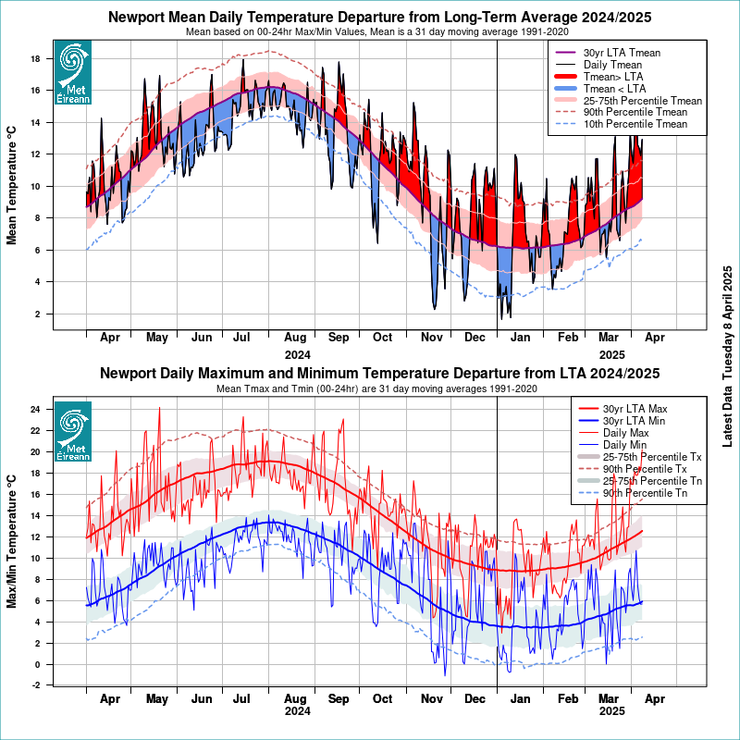
Temperature Departures from LTA