So July ended with the same rainfall as last year but 1.6 degrees cooler. Note that August 1, in one day, we had almost as much rain as we had the entire month of July. That's caused the grapes to swell rather quickly and they are noticeably bigger today than on Saturday.
Meanwhile, Cathal Keane has arrived to begin work on the construction of the trellis structure that will support the remaining vines as they mature. Today, he is digging the holes for the uprights -- telephone poles discarded as they are replaced in our area. Tomorrow, they begin cementing in the poles in the holes. It's a big job.


Monthly values for NEWPORT up to 01-aug-2022
Total rainfall in millimetres for NEWPORT
| Year | Jan | Feb | Mar | Apr | May | Jun | Jul | Aug | Sep | Oct | Nov | Dec | Annual |
|---|
| 2022 | 98.8 | 260.4 | 67.8 | 84.0 | 107.0 | 148.0 | 59.2 | 47.5 | | | | | 872.7 |
| 2021 | 225.6 | 147.6 | 141.1 | 45.6 | 113.5 | 64.1 | 59.7 | 155.6 | 137.0 | 265.7 | 183.3 | 186.6 | 1725.4 |
| 2020 | 139.5 | 342.8 | 178.2 | 25.5 | 54.7 | 164.5 | 187.9 | 137.9 | 153.4 | 228.0 | 206.6 | 232.7 | 2051.7 |
| 2019 | 146.8 | 115.0 | 228.5 | 100.7 | 112.5 | 76.6 | 82.7 | 228.9 | 175.5 | 160.7 | 148.1 | 220.6 | 1796.6 |
| LTA | 166.7 | 126.5 | 141.2 | 96.8 | 94.7 | 89.7 | 100.9 | 132.5 | 131.5 | 176.0 | 170.4 | 180.2 | 1607.1 |
Mean temperature in degrees Celsius for NEWPORT
| Year | Jan | Feb | Mar | Apr | May | Jun | Jul | Aug | Sep | Oct | Nov | Dec | Annual |
|---|
| 2022 | 7.2 | 7.1 | 8.0 | 9.9 | 12.6 | 13.8 | 15.9 | 15.0 | | | | | 10.7 |
| 2021 | 5.0 | 6.7 | 7.9 | 9.0 | 10.4 | 13.3 | 17.5 | 16.4 | 15.2 | 11.9 | 9.3 | 7.6 | 10.9 |
| 2020 | 7.2 | 6.0 | 6.6 | 11.0 | 12.8 | 13.8 | 14.4 | 16.0 | 13.8 | 10.5 | 9.1 | 6.1 | 10.6 |
| 2019 | 6.9 | 8.4 | 7.9 | 10.2 | 11.7 | 13.1 | 16.3 | 15.5 | 13.7 | 10.3 | 7.1 | 7.1 | 10.7 |
| LTA | 6.1 | 6.1 | 7.3 | 9.0 | 11.5 | 13.8 | 15.4 | 15.4 | 13.5 | 10.8 | 8.3 | 6.5 | 10.3 |
Mean 10cm soil temperature for NEWPORT at 0900 UTC
| Year | Jan | Feb | Mar | Apr | May | Jun | Jul | Aug | Sep | Oct | Nov | Dec | Annual |
|---|
| 2022 | 6.2 | 6.2 | 6.3 | 9.3 | 13.2 | 14.8 | 16.8 | n/a | | | | | 10.4 |
| 2021 | 3.6 | 5.0 | 6.8 | 8.2 | 10.9 | 14.3 | 17.9 | 16.3 | 15.2 | 11.3 | 8.6 | 6.6 | 10.4 |
| 2020 | 5.7 | 4.7 | 5.4 | 9.7 | 13.0 | 14.8 | 14.9 | 16.3 | 13.7 | 9.5 | 8.0 | 5.1 | 10.1 |
| 2019 | 6.1 | 6.1 | 6.8 | 8.9 | 12.2 | 13.8 | 16.7 | 15.7 | 13.5 | 9.4 | 6.2 | 5.6 | 10.1 |
| LTA | n/a | n/a | n/a | n/a | n/a | n/a | n/a | n/a | n/a | n/a | n/a | n/a | n/a |
Global Solar Radiation in Joules/cm2 for NEWPORT
| Year | Jan | Feb | Mar | Apr | May | Jun | Jul | Aug | Sep | Oct | Nov | Dec | Annual |
|---|
| 2022 | 6311 | 10756 | 33399 | 40555 | 51569 | 47246 | 48439 | 393 | | | | | 238668 |
| 2021 | 6620 | 13347 | 20370 | 45694 | 55690 | 45488 | 49455 | 40490 | 22413 | 16358 | 7235 | 3780 | 326940 |
| 2020 | 6263 | 10808 | 24545 | 46192 | 58476 | 43537 | 40215 | 40555 | 25558 | 18487 | 6319 | 5209 | 326164 |
| 2019 | 5378 | 10595 | 21306 | 37648 | 49884 | 49607 | 45395 | 37116 | 26460 | 17406 | 8167 | 4766 | 313728 |
| LTA | n/a | n/a | n/a | n/a | n/a | n/a | n/a | n/a | n/a | n/a | n/a | n/a | n/a |
Potential Evapotranspiration (mm) for NEWPORT
| Year | Jan | Feb | Mar | Apr | May | Jun | Jul | Aug | Sep | Oct | Nov | Dec | Annual |
|---|
| 2022 | 13.7 | 23.0 | 47.2 | 60.6 | 77.7 | 76.0 | 80.4 | 1.2 | | | | | 379.8 |
| 2021 | 7.6 | 22.9 | 30.7 | 62.9 | 76.3 | 70.7 | 87.8 | 67.5 | 38.3 | 25.1 | 14.1 | 14.6 | 518.5 |
| 2020 | 17.6 | 21.9 | 35.0 | 70.2 | 91.6 | 72.9 | 66.2 | 66.4 | 42.7 | 28.1 | 13.6 | 10.4 | 536.6 |
| 2019 | 13.4 | 21.5 | 35.4 | 60.4 | 79.0 | 78.2 | 79.5 | 62.9 | 42.8 | 29.2 | 14.8 | 14.3 | 531.4 |
| LTA | n/a | n/a | n/a | n/a | n/a | n/a | n/a | n/a | n/a | n/a | n/a | n/a | n/a |
Evaporation (mm) for NEWPORT
| Year | Jan | Feb | Mar | Apr | May | Jun | Jul | Aug | Sep | Oct | Nov | Dec | Annual |
|---|
| 2022 | 17.9 | 32.4 | 66.5 | 86.8 | 114.5 | 109.2 | 111.1 | 1.6 | | | | | 540.0 |
| 2021 | 10.9 | 32.1 | 45.4 | 89.9 | 111.2 | 102.0 | 117.2 | 93.5 | 52.1 | 34.7 | 18.6 | 19.1 | 726.7 |
| 2020 | 22.4 | 31.9 | 51.8 | 98.9 | 130.8 | 104.8 | 94.3 | 92.7 | 59.1 | 38.8 | 18.1 | 13.6 | 757.2 |
| 2019 | 17.7 | 29.5 | 52.0 | 87.3 | 111.6 | 112.8 | 109.6 | 88.8 | 59.9 | 39.6 | 18.9 | 17.9 | 745.6 |
| LTA | n/a | n/a | n/a | n/a | n/a | n/a | n/a | n/a | n/a | n/a | n/a | n/a | n/a |
Degree Days Below 15.5 Degree Celsius for NEWPORT
|
| Year | Jan | Feb | Mar | Apr | May | Jun | Jul | Aug | Sep | Oct | Nov | Dec | Total |
|---|
| 2022 | 256 | 234 | 235 | 171 | 97 | 63 | 30 | N/A | N/A | N/A | N/A | N/A | N/A |
| 2021 | 325 | 247 | 236 | 200 | 167 | 79 | 20 | 23 | 40 | 114 | 187 | 245 | 1883 |
| 2020 | 257 | 276 | 275 | 143 | 111 | 73 | 55 | 31 | 71 | 156 | 193 | 291 | 1935 |
| 2019 | 266 | 200 | 235 | 165 | 130 | 89 | 27 | 36 | 67 | 164 | 251 | 262 | 1892 |
Notes on the Data
Evaporation and PE data are calculated using Penman/Monteith formulae.
The ‘LTA’ (referred to within a table) is average for the climatological long-term-average (LTA) reference period 1981-2010.
Data updated daily at Mid-day.
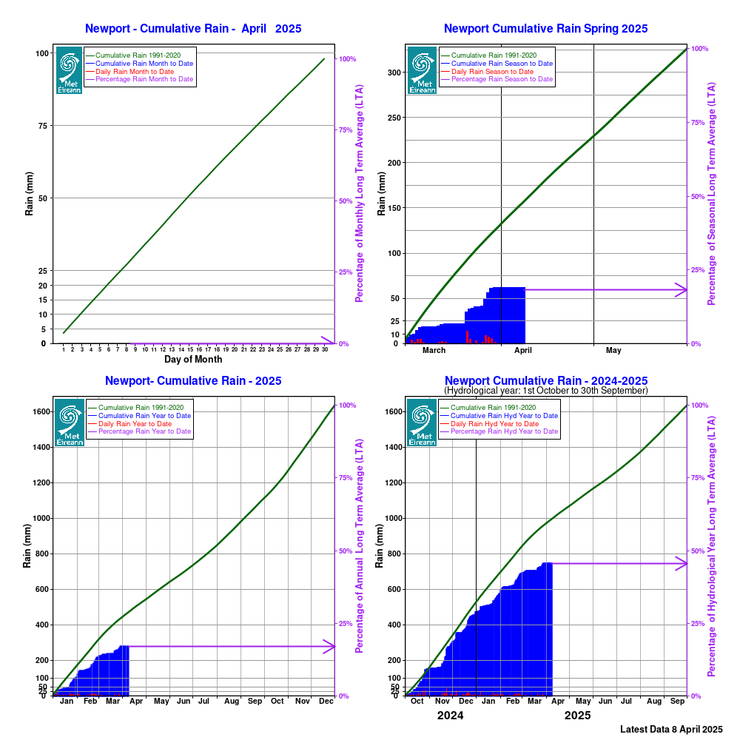
Cumulative Rainfall Graphs
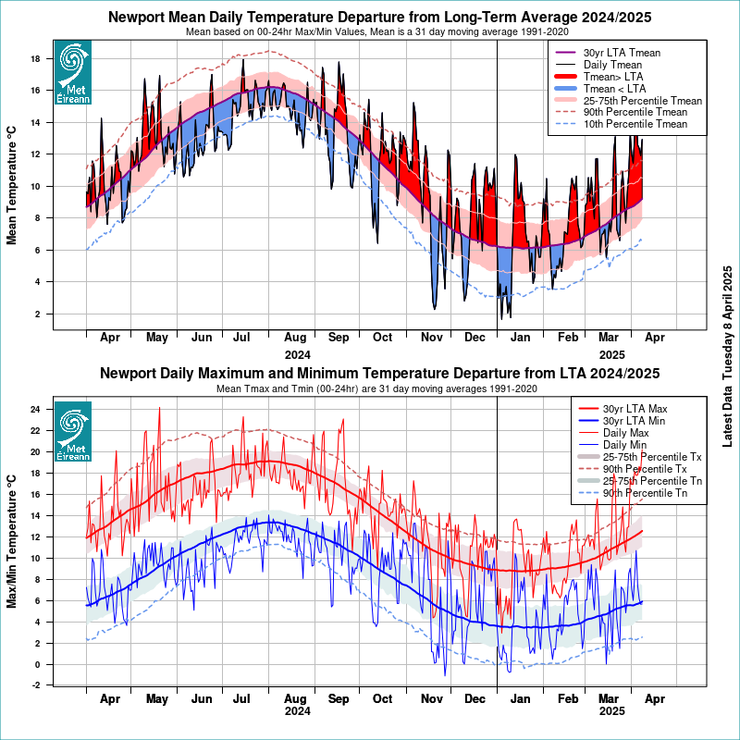
Temperature Departures from LTA


No comments:
Post a Comment