Friday, 28 June 2024

Wine production in Ireland


Old Roots Vineyard in County Wexford planted more than 11,000 vines in 2015, the same year we planted our first ten. They are producing wine and bottling in small bottles for the hospitality trade. They have 8 varieties and planting more. Their winery, which has capacity for 25,000 bottles, first produced wine in 2019 and RTE interviewed them about winemaking in Ireland. 

In the article, they mention there are others including in Mayo. That would be us!

Meanwhile, an article in the Guardian reveals there are 24 vineyards in Yorkshire and 2 in Scotland. According to the Guardian, there are now 943 vineyards in the UK, almost triple the number 20 years ago, according to a report published in June 2023 by WineGB.


Thursday, 27 June 2024

Blowin' in the wind


The weather is pretty nasty today as Storm Jimmy barrels through dropping much-needed rain and strong gusty winds. The strongest gust so far is 49.1 knots but the worst is yet to come they say. We got almost 5 mm rain overnight. 

I hope the vines don't suffer too much damage. I'm glad I gave them a lift up onto the trellises. I hope they had enough time to get a grip. 

Monday, 24 June 2024

Progress in the vineyard


The vines are looking good despite very little rainfall this month. Today's vineyard chore was to raise the canes up onto the trellises and to snip the ends of rapidly growing vines. There's a gale on the way and today is quite windy gusting into the 20s, so I didn't want them to get whipped around and damaged by the wind.  It was quite easy to snip them this year as it was very clear where the florets stopped forming. 

I just love being in the vineyard. 


Met Éireann today issued a report called Translate. It's a unified approach to predict the extent of climate change effects and develop services to help with mitigation and adaptation. TRANSLATE1990 was  9.5C. In the period from 1991-2020 it was 10.25C. That's 0.75 higher in just 30 years. Our mean annual rainfall for the first period was 1261.50. In the more recent period, it was 1380.9 mm. 

Interestingly, we've always known we had a microclimate but our specific area of Clew Bay seems to have experienced less change than parts of Connemara and the southwest. This is their prediction for Mayo in a 1.5C increased climate. 

Mayo in a 1.5 degree world.

The mean annual air temperature in Mayo is projected to be 10.08°C in a 1.5-degree world. Average winter and summer precipitation rates are projected to be 5.36 mm/day and 3.10mm/day respectively.

A summary of change values (relative to 1976-2005) are shown below, along with ranges calculated from the 10th-90th percentile of the TRANSLATE ensemble.
Variable1.5°C GWL
Annual Mean Temperature (°C)0.72
(0.34 to 0.97)
Mean Winter Minimum Temperature (°C)0.64
(0.17 to 1.11)
Mean Summer Maximum Temperature (°C)0.64
(0.34 to 1.13)
Winter Precipitation Rate (%)6.21
(0.04 to 13.72)
Summer Precipitation Rate (%)0.80
(-11.78 to 10.70)

Saturday, 22 June 2024

Developmental status


A little rain followed by a lot of sun and everything is in super growth mode. The Rondo florets are quite prolific and robust, as are the Solaris. The Pinot Noir has many florets and is slightly behind in development. I only saw one on the Chardonnay vines and it was just beginning. So the experiment is pointing toward Pinot Noir as a potential major contributor. 

On other fronts, we had a feed of mange toute, peas and beans last night. Broad beans are very satisfying to grow, but way too much work to be worthwhile, requiring shelling, parboiling and removal of the skins before contemplating eating them. The raspberries are scruptious and the strawberries are on their way. Yum. 

Pinot Noir

Pinot Noir

Pinot Noir

Rondo

Solaris

The only Chardonnay bunch visible

Purple spotted orchid

Broad beans

Strawberries


Friday, 21 June 2024

No summer yet


Yesterday evening was the summer solstice, but it was already getting dark by 7:30, not at all the longest day of the year. Jean Duff and her friends from DC, Mary and Henry, stopped by in the afternoon to visit the vineyard. Henry is an oenophile and brought a very interesting bottle of Rioja along. We gave them the grand tour.

Curiously, the vines are still growing straight up. The Albarino looks pitiful but the Pinot Noir has lots of florets. It was a fun afternoon with very nice people. It became very cloudy but did not rain. Today it is raining and we need it. We need rain and warmth. Our temperature so far has averaged 12.2C. The LTA is 13.8C and May came in at 13.1. It is to warm up into the 20s next week but then return to 'normal'. I hope we don't have a repeat of last year's July with twice the normal rainfall. 

NOAA has announced that El Nino is over and we are now in a period of neutrality before La Nina sets in. We've had our first tropical storm, Alberto, of the Atlantic Hurricane season. The daily SST is still in record territory so the season, though late starting, could still be potentially intense as forecast. Nothing is normal so it is hard to predict.


Tuesday, 11 June 2024

June is cold - brrrrr!


Last night the temperature dropped to 4C. Today it's overcast and downright cold. They said it was to be 15C mid-day, but with the breeze, it feels damned cold. Wearing fleece and quilted vest and still chilled. 

Saturday was lovely and sunny, and we had visitors for pizza lunch and a tour of the vineyard and hilltop. Sunday, it was drizzly and cool all day and we went for the open garden tour at Drimbawn in Tourmakeady. It was very enjoyable despite the weather. The head gardener, Frank Steffens, said he has been thinking about planting a vineyard on his own land, a South-facing slope, if he ever finds the money and the time. I learned a lot by studying what they've done there. They've come a long way since we were there last perhaps 5 or so years ago. 

The forecast for tomorrow is 3-5C overnight and 15C max during the day but at least it won't be windy. I don't know about this year's crop. The new growth is climbing vertically for some reason. In prior years it has always growth horizontally. The strawberries are growing up to the sky as well. Perhaps they are reaching for the sun?


Hattie enjoying the view.


Wednesday, 5 June 2024

May was the warmest on record


Met Eireann has reported that May 2024 was the warmest on record, with an average temperature of 13.08C. It is only the second time in recorded history that the temperature in May exceeded 13C. This is 2.53 degrees above the 1961-1990 long-term average (LTA) or 1.74 degrees above the 1991-2020 LTA for May.

The global average temperature for the past 12 months (May 2023 – April 2024) is the highest on record, at 0.73°C above the 1991-2020 average and 1.61°C above the 1850-1900 pre-industrial average.  And this May is likely to extend the streak, especially given record high sea surface temperatures. 


Sunday, 2 June 2024

May weather


Wow, May was dry for the second year in a row, almost identical to last year. The temp was 1.6C above the LTA and nearly identical to last year. The soil temperature was also warmer than the LTA and similar to the past two years. Is this a new pattern emerging?  I know two years doesn't make a conclusive statement, just sayin'.

Mexico is burning up with Merida having consistent daytime temperatures in the 40C+ range, and it is almost out of water. India is burning up, too. Yet the countries most vulnerable to climate change are Chad, Somalia, Syria, DRC and Afghanistan. I feel hot and dry just thinking about these places. 

Thankfully, we are fortunate in green lush surroundings. 


Monthly values for NEWPORT up to 01-jun-2024

Total rainfall in millimetres for NEWPORT

YearJanFebMarAprMayJunJulAugSepOctNovDecAnnual
2024125.7197.5152.5119.448.80.0643.9
2023183.291.6188.4121.148.577.9206.8139.8142.4144.7209.6293.81847.8
202298.8260.467.884.0107.0148.059.2104.197.3233.9187.5154.61602.6
2021225.6147.6141.145.6113.564.159.7155.6137.0265.7183.3186.61725.4
LTA166.7126.5141.296.894.789.7100.9132.5131.5176.0170.4180.21607.1

Mean temperature in degrees Celsius for NEWPORT

YearJanFebMarAprMayJunJulAugSepOctNovDecAnnual
20246.17.97.99.913.113.29.0
20236.68.07.69.913.317.414.915.815.211.98.77.911.4
20227.27.18.09.912.613.815.916.2n/a12.29.45.210.7
20215.06.77.99.010.413.317.516.415.211.99.37.610.9
LTA6.16.17.39.011.513.815.415.413.510.88.36.510.3

Mean 10cm soil temperature for NEWPORT at 0900 UTC

YearJanFebMarAprMayJunJulAugSepOctNovDecAnnual
20244.26.56.59.513.6n/a8.1
20235.26.86.69.113.718.616.316.314.711.17.66.711.1
20226.26.26.39.313.214.816.816.6n/a11.58.44.410.4
20213.65.06.88.210.914.317.916.315.211.38.66.610.4
LTAn/an/an/an/an/an/an/an/an/an/an/an/an/a

Global Solar Radiation in Joules/cm2 for NEWPORT

YearJanFebMarAprMayJunJulAugSepOctNovDecAnnual
20247248124012303239685473333080132779
2023624510639214293727755732584734179736857293381622583264411326749
2022631110756333994055551569472464843951169n/a1598878696167319468
2021662013347203704569455690454884945540490224131635872353780326940
LTAn/an/an/an/an/an/an/an/an/an/an/an/an/a

Potential Evapotranspiration (mm) for NEWPORT

YearJanFebMarAprMayJunJulAugSepOctNovDecAnnual
202415.418.236.056.974.74.1205.3
202314.320.933.056.483.3100.670.164.450.126.114.214.7548.1
202213.723.047.260.677.776.080.482.0n/a27.217.29.2514.2
20217.622.930.762.976.370.787.867.538.325.114.114.6518.5
LTAn/an/an/an/an/an/an/an/an/an/an/an/an/a

Evaporation (mm) for NEWPORT

YearJanFebMarAprMayJunJulAugSepOctNovDecAnnual
202420.225.451.983.7104.95.8291.9
202318.828.247.681.6118.2137.199.589.167.835.518.419.0760.8
202217.932.466.586.8114.5109.2111.1113.2n/a37.022.011.4722.0
202110.932.145.489.9111.2102.0117.293.552.134.718.619.1726.7
LTAn/an/an/an/an/an/an/an/an/an/an/an/an/a

Degree Days Below 15.5 Degree Celsius for NEWPORT

YearJanFebMarAprMayJunJulAugSepOctNovDecTotal
202429322123416991N/AN/AN/AN/AN/AN/AN/AN/A
202327521024617185183926531182032371681
202225623423517197633028N/A103185320N/A
2021325247236200167792023401141872451883

Notes on the Data

Evaporation and PE data are calculated using Penman/Monteith formulae.
The ‘LTA’ (referred to within a table) is average for the climatological long-term-average (LTA) reference period 1981-2010.
Data updated daily at Mid-day.
To view the Weather Events for Public Works Contracts data, select a station first, then click the link just below the map.

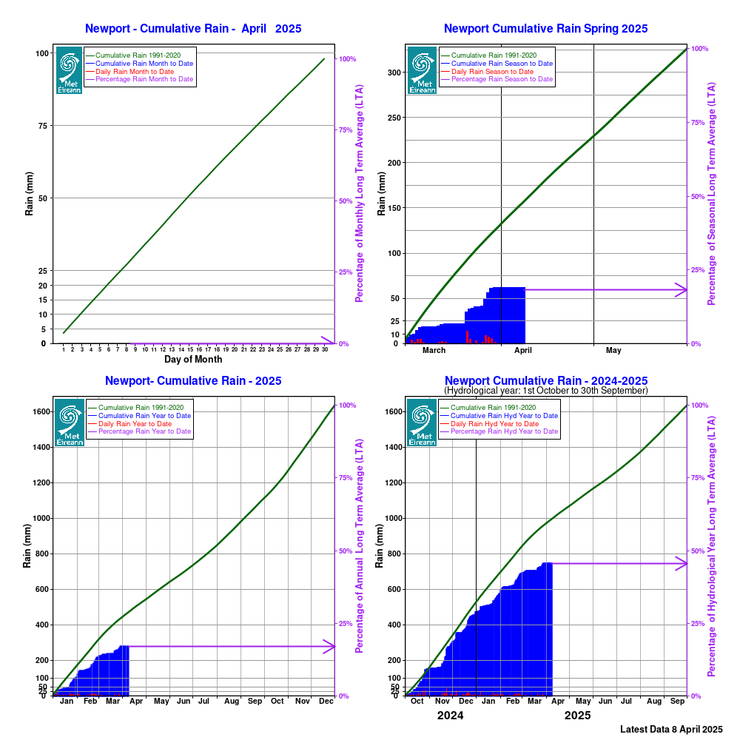
Cumulative Rainfall Graphs

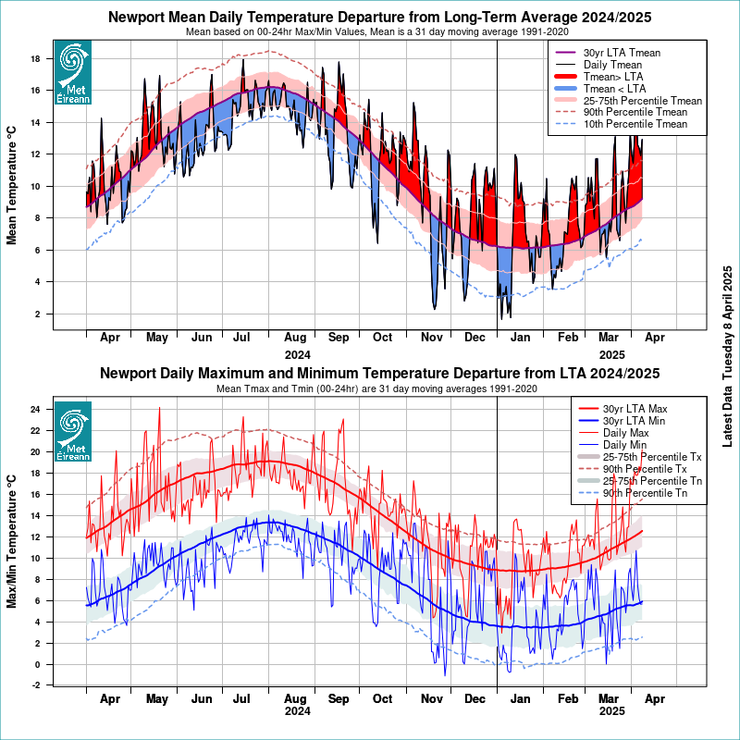
Temperature Departures from LTA