Wow, May was dry for the second year in a row, almost identical to last year. The temp was 1.6C above the LTA and nearly identical to last year. The soil temperature was also warmer than the LTA and similar to the past two years. Is this a new pattern emerging? I know two years doesn't make a conclusive statement, just sayin'.
Mexico is burning up with Merida having consistent daytime temperatures in the 40C+ range, and it is almost out of water. India is burning up, too. Yet the countries most vulnerable to climate change are Chad, Somalia, Syria, DRC and Afghanistan. I feel hot and dry just thinking about these places.
Thankfully, we are fortunate in green lush surroundings.

Monthly values for NEWPORT up to 01-jun-2024
Total rainfall in millimetres for NEWPORT
| Year | Jan | Feb | Mar | Apr | May | Jun | Jul | Aug | Sep | Oct | Nov | Dec | Annual |
|---|
| 2024 | 125.7 | 197.5 | 152.5 | 119.4 | 48.8 | 0.0 | | | | | | | 643.9 |
| 2023 | 183.2 | 91.6 | 188.4 | 121.1 | 48.5 | 77.9 | 206.8 | 139.8 | 142.4 | 144.7 | 209.6 | 293.8 | 1847.8 |
| 2022 | 98.8 | 260.4 | 67.8 | 84.0 | 107.0 | 148.0 | 59.2 | 104.1 | 97.3 | 233.9 | 187.5 | 154.6 | 1602.6 |
| 2021 | 225.6 | 147.6 | 141.1 | 45.6 | 113.5 | 64.1 | 59.7 | 155.6 | 137.0 | 265.7 | 183.3 | 186.6 | 1725.4 |
| LTA | 166.7 | 126.5 | 141.2 | 96.8 | 94.7 | 89.7 | 100.9 | 132.5 | 131.5 | 176.0 | 170.4 | 180.2 | 1607.1 |
Mean temperature in degrees Celsius for NEWPORT
| Year | Jan | Feb | Mar | Apr | May | Jun | Jul | Aug | Sep | Oct | Nov | Dec | Annual |
|---|
| 2024 | 6.1 | 7.9 | 7.9 | 9.9 | 13.1 | 13.2 | | | | | | | 9.0 |
| 2023 | 6.6 | 8.0 | 7.6 | 9.9 | 13.3 | 17.4 | 14.9 | 15.8 | 15.2 | 11.9 | 8.7 | 7.9 | 11.4 |
| 2022 | 7.2 | 7.1 | 8.0 | 9.9 | 12.6 | 13.8 | 15.9 | 16.2 | n/a | 12.2 | 9.4 | 5.2 | 10.7 |
| 2021 | 5.0 | 6.7 | 7.9 | 9.0 | 10.4 | 13.3 | 17.5 | 16.4 | 15.2 | 11.9 | 9.3 | 7.6 | 10.9 |
| LTA | 6.1 | 6.1 | 7.3 | 9.0 | 11.5 | 13.8 | 15.4 | 15.4 | 13.5 | 10.8 | 8.3 | 6.5 | 10.3 |
Mean 10cm soil temperature for NEWPORT at 0900 UTC
| Year | Jan | Feb | Mar | Apr | May | Jun | Jul | Aug | Sep | Oct | Nov | Dec | Annual |
|---|
| 2024 | 4.2 | 6.5 | 6.5 | 9.5 | 13.6 | n/a | | | | | | | 8.1 |
| 2023 | 5.2 | 6.8 | 6.6 | 9.1 | 13.7 | 18.6 | 16.3 | 16.3 | 14.7 | 11.1 | 7.6 | 6.7 | 11.1 |
| 2022 | 6.2 | 6.2 | 6.3 | 9.3 | 13.2 | 14.8 | 16.8 | 16.6 | n/a | 11.5 | 8.4 | 4.4 | 10.4 |
| 2021 | 3.6 | 5.0 | 6.8 | 8.2 | 10.9 | 14.3 | 17.9 | 16.3 | 15.2 | 11.3 | 8.6 | 6.6 | 10.4 |
| LTA | n/a | n/a | n/a | n/a | n/a | n/a | n/a | n/a | n/a | n/a | n/a | n/a | n/a |
Global Solar Radiation in Joules/cm2 for NEWPORT
| Year | Jan | Feb | Mar | Apr | May | Jun | Jul | Aug | Sep | Oct | Nov | Dec | Annual |
|---|
| 2024 | 7248 | 12401 | 23032 | 39685 | 47333 | 3080 | | | | | | | 132779 |
| 2023 | 6245 | 10639 | 21429 | 37277 | 55732 | 58473 | 41797 | 36857 | 29338 | 16225 | 8326 | 4411 | 326749 |
| 2022 | 6311 | 10756 | 33399 | 40555 | 51569 | 47246 | 48439 | 51169 | n/a | 15988 | 7869 | 6167 | 319468 |
| 2021 | 6620 | 13347 | 20370 | 45694 | 55690 | 45488 | 49455 | 40490 | 22413 | 16358 | 7235 | 3780 | 326940 |
| LTA | n/a | n/a | n/a | n/a | n/a | n/a | n/a | n/a | n/a | n/a | n/a | n/a | n/a |
Potential Evapotranspiration (mm) for NEWPORT
| Year | Jan | Feb | Mar | Apr | May | Jun | Jul | Aug | Sep | Oct | Nov | Dec | Annual |
|---|
| 2024 | 15.4 | 18.2 | 36.0 | 56.9 | 74.7 | 4.1 | | | | | | | 205.3 |
| 2023 | 14.3 | 20.9 | 33.0 | 56.4 | 83.3 | 100.6 | 70.1 | 64.4 | 50.1 | 26.1 | 14.2 | 14.7 | 548.1 |
| 2022 | 13.7 | 23.0 | 47.2 | 60.6 | 77.7 | 76.0 | 80.4 | 82.0 | n/a | 27.2 | 17.2 | 9.2 | 514.2 |
| 2021 | 7.6 | 22.9 | 30.7 | 62.9 | 76.3 | 70.7 | 87.8 | 67.5 | 38.3 | 25.1 | 14.1 | 14.6 | 518.5 |
| LTA | n/a | n/a | n/a | n/a | n/a | n/a | n/a | n/a | n/a | n/a | n/a | n/a | n/a |
Evaporation (mm) for NEWPORT
| Year | Jan | Feb | Mar | Apr | May | Jun | Jul | Aug | Sep | Oct | Nov | Dec | Annual |
|---|
| 2024 | 20.2 | 25.4 | 51.9 | 83.7 | 104.9 | 5.8 | | | | | | | 291.9 |
| 2023 | 18.8 | 28.2 | 47.6 | 81.6 | 118.2 | 137.1 | 99.5 | 89.1 | 67.8 | 35.5 | 18.4 | 19.0 | 760.8 |
| 2022 | 17.9 | 32.4 | 66.5 | 86.8 | 114.5 | 109.2 | 111.1 | 113.2 | n/a | 37.0 | 22.0 | 11.4 | 722.0 |
| 2021 | 10.9 | 32.1 | 45.4 | 89.9 | 111.2 | 102.0 | 117.2 | 93.5 | 52.1 | 34.7 | 18.6 | 19.1 | 726.7 |
| LTA | n/a | n/a | n/a | n/a | n/a | n/a | n/a | n/a | n/a | n/a | n/a | n/a | n/a |
Degree Days Below 15.5 Degree Celsius for NEWPORT
|
| Year | Jan | Feb | Mar | Apr | May | Jun | Jul | Aug | Sep | Oct | Nov | Dec | Total |
|---|
| 2024 | 293 | 221 | 234 | 169 | 91 | N/A | N/A | N/A | N/A | N/A | N/A | N/A | N/A |
| 2023 | 275 | 210 | 246 | 171 | 85 | 18 | 39 | 26 | 53 | 118 | 203 | 237 | 1681 |
| 2022 | 256 | 234 | 235 | 171 | 97 | 63 | 30 | 28 | N/A | 103 | 185 | 320 | N/A |
| 2021 | 325 | 247 | 236 | 200 | 167 | 79 | 20 | 23 | 40 | 114 | 187 | 245 | 1883 |
Notes on the Data
Evaporation and PE data are calculated using Penman/Monteith formulae.
The ‘LTA’ (referred to within a table) is average for the climatological long-term-average (LTA) reference period 1981-2010.
Data updated daily at Mid-day.
To view the Weather Events for Public Works Contracts data, select a station first, then click the link just below the map.
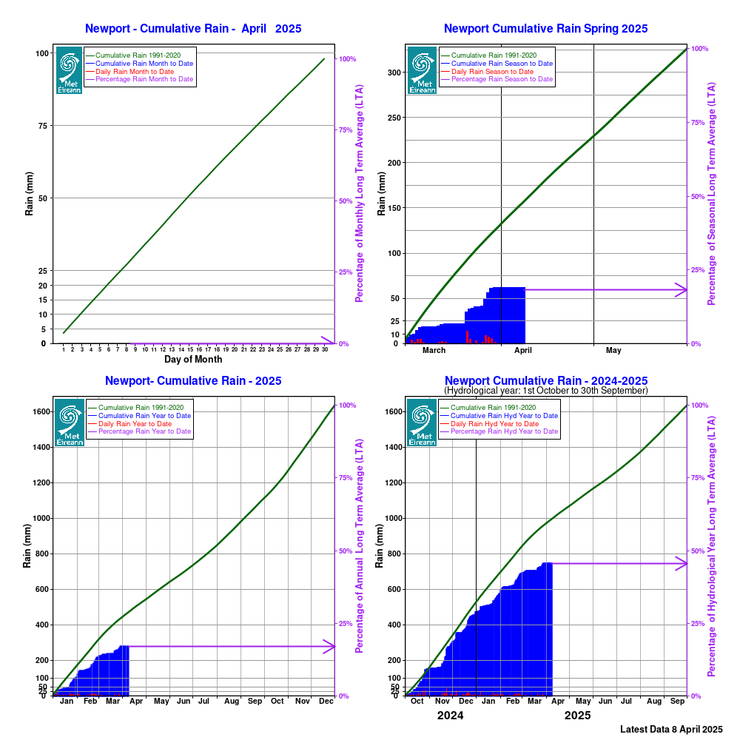
Cumulative Rainfall Graphs
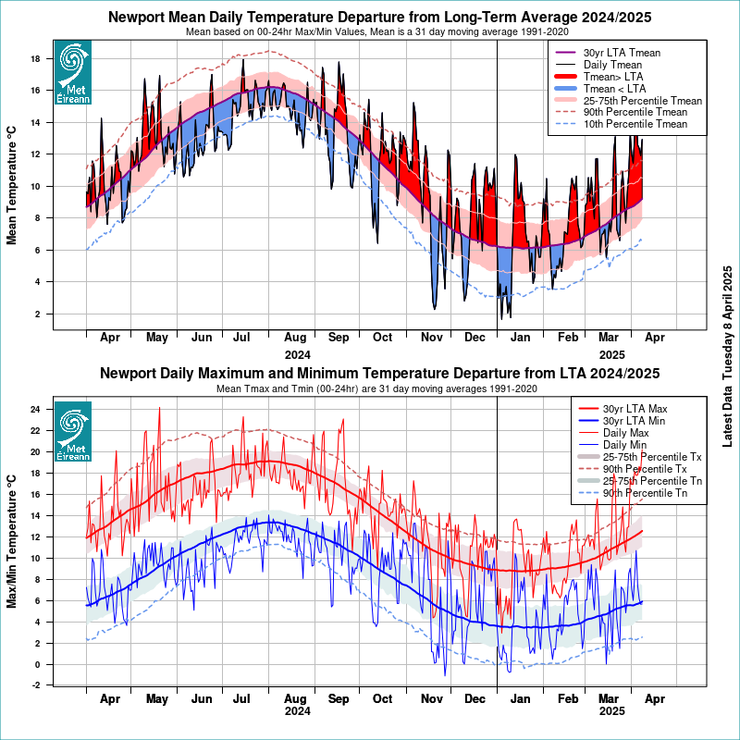
Temperature Departures from LTA


No comments:
Post a Comment